This entry is intended to review the use of the Multiple Float-Path calculation option in Primavera Project Management (P6) and to offer a brief example of its use compared to BPC Logic Filter (for Microsoft Project).
Project schedules generated using the Critical Path Method (CPM) are commonly used to model – and to document – the project team’s plan for executing the scope of work. Such a plan normally involves identifying necessary activities at an appropriate level of detail and specifying the necessary sequential relationships between them. The output from the CPM analysis is a list of activities with associated durations, dates, and float values – this constitutes “the schedule”.
Unfortunately, the sequential relationships that ultimately drive the schedule (i.e. the logical “plan”) can be difficult to communicate or analyze for all but the simplest projects. This is because Total Float – the telltale indicator of logical-path connectivity in simple projects – becomes unreliable (or unintelligible) for such purposes in the presence of variable activity calendars or late constraints. As a result, complex schedule models lose both usefulness and credibility among project stakeholders unless schedule managers go beyond the simple communication of dates, durations, and float.
Multiple Float Paths
Oracle’s Primavera P6 software (P6) has always included an option to compute “Multiple Float Paths” when calculating the schedule, but many experienced planners seem unfamiliar with it. The option facilitates the identification of the “driving” and “near-driving” logical paths for a single selected activity. The selected activity can be a key project milestone that may or may not correspond to the end of the project, or it may be a simple intermediate activity of particular or urgent concern.
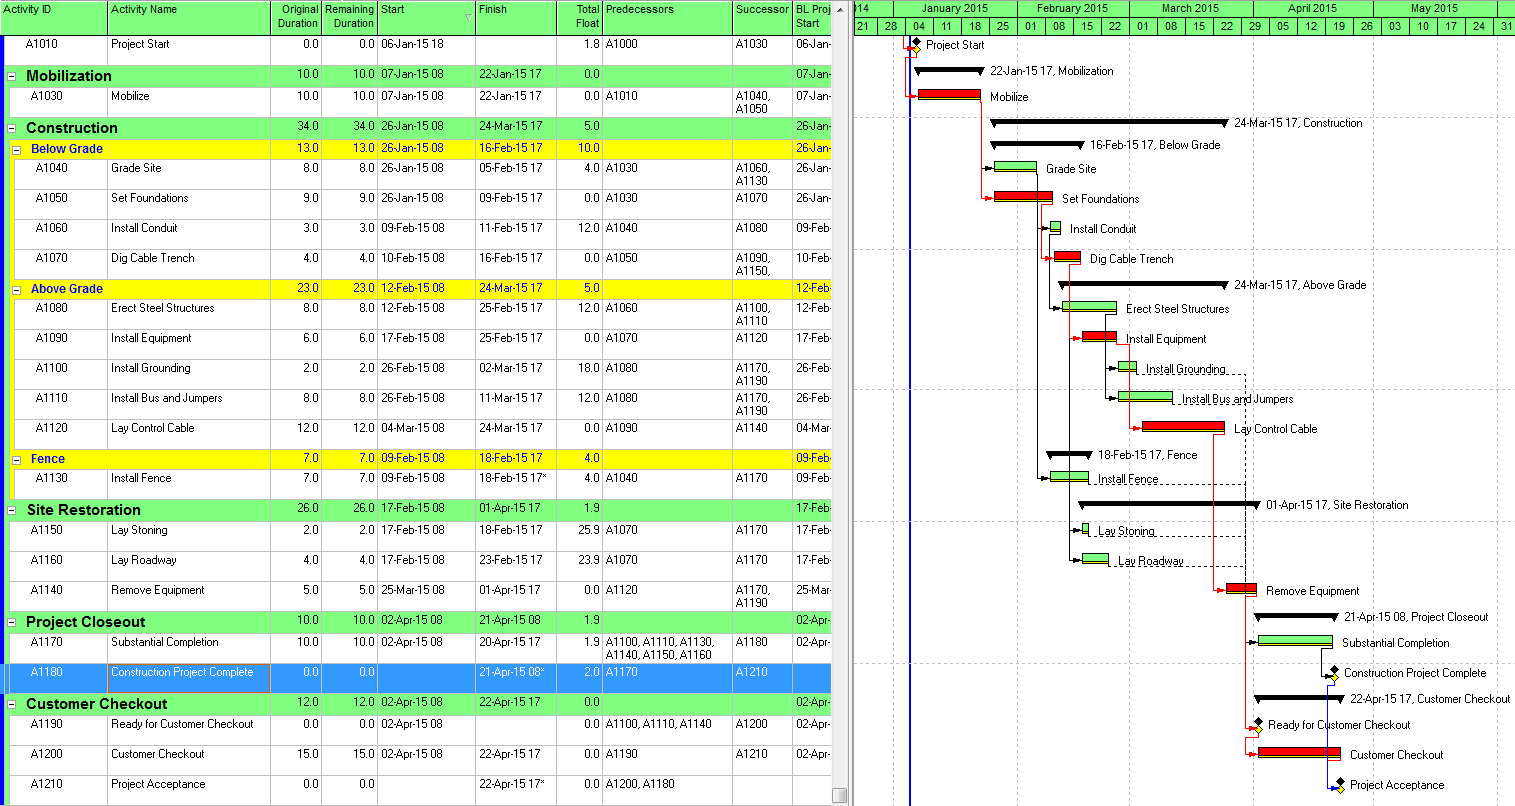
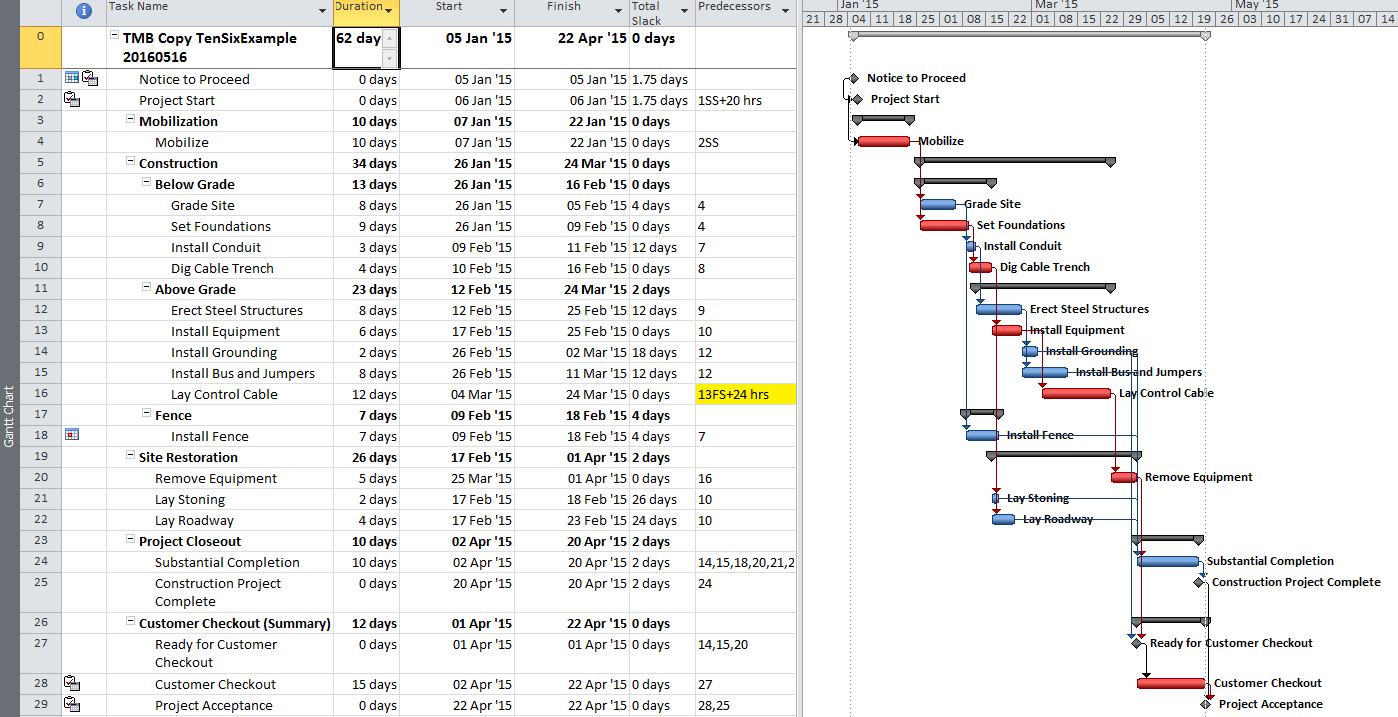
Figure 1 represents a simple project for construction and handover of a small utility installation – originally modeled in Microsoft Project and then converted to Primavera P6. (The model was developed primarily for illustrating the impact of calendars and constraints; the work techniques illustrated are neither typical nor ideal.)
- There are contractually-derived late-finish constraints on the Construction Project Complete milestone (24Apr’15) and the final Project Acceptance milestone (29Apr’15). These constraints affect the late dates (and consequently Total Float) for these activities and (parts of) their chains of predecessors.
- There is a late-finish constraint (25Feb’15) on the “Install Fence” activity (reason not known), with similar impacts on late dates and Total Float.
- Activities are scheduled using a 4d x 8h work week (M-Th), except for the two initial milestones which utilize a 24-hour calendar, and the final two Customer Checkout activies which utilize a 5d x 8h workweek.
- The “Notice to Proceed” milestone is constrained to start no earlier than 10:00 PM on 05Jan’15.
- P6’s scheduling options are set to define critical path activities on the basis of “Longest Path” rather than Total Float, and the Gantt chart appears to properly display the Critical Path by this definition. Thus, the two initial milestones are marked as critical because they are driving the project’s completion, even though their calendars allow a higher value for total float.
Although “Longest Path” appears to correctly identify the driving path to the project completion (the Project Acceptance milestone), the contractor is equally interested in identifying the driving path to the “Construction Project Complete” intermediate milestone.
In P6’s advanced schedule options, we select “calculate multiple float paths” ending with the “Construction Project Complete” milestone” (Figure 2). As a rule, we calculate the multiple paths using “free float” rather than “total float”, since the former option best mimics “longest path” behavior.* The default number of paths to calculate is ten.
* See “P6-multiple-float-path-analysis-total-float-and-free-float-options” for more on these options.
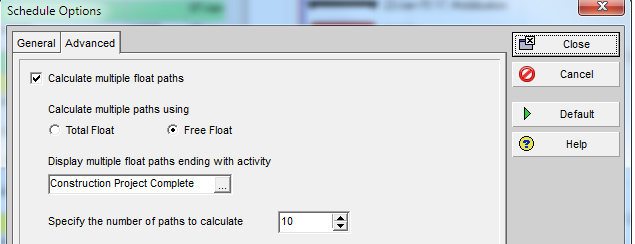
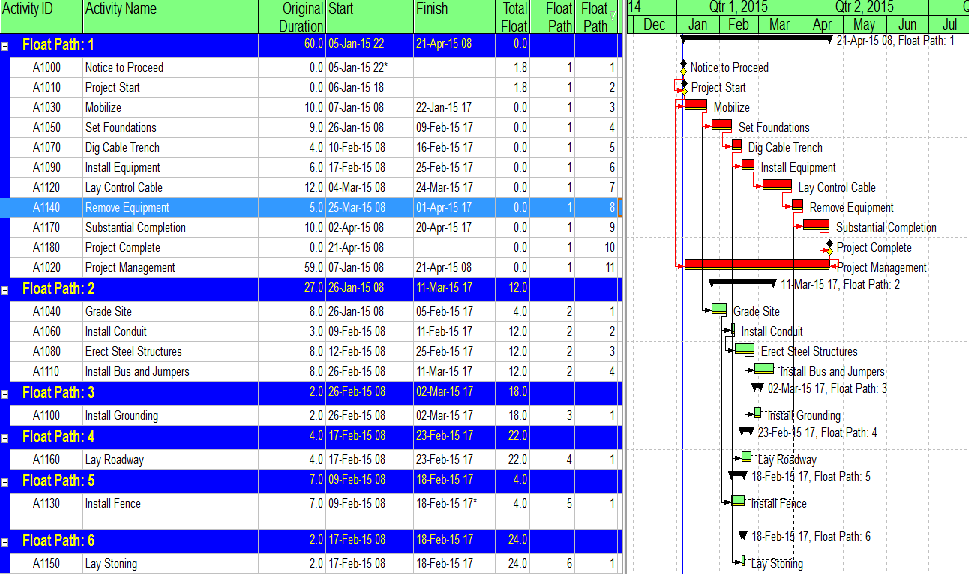
Figure 3 illustrates the result of re-calculating the schedule then displaying a layout that arranges the activities by “Float Path” and sorting by “Float Path Order”. In this figure, “Float Path 1” is the driving logical path leading to the Construction Project Complete milestone. “Float Path 2” defines the first near-driving-path, “Float Path 3” defines the next near-driving path, etc. Each “float path” is essentially a discrete branch from the main, driving logical path. Obviously, Float Path 1 defines the activities that offer the most opportunity to accelerate the construction project (and maybe the most risk of extending it.) According to the figure, higher float paths tend to have higher values of total float, though the correlation is not universal.
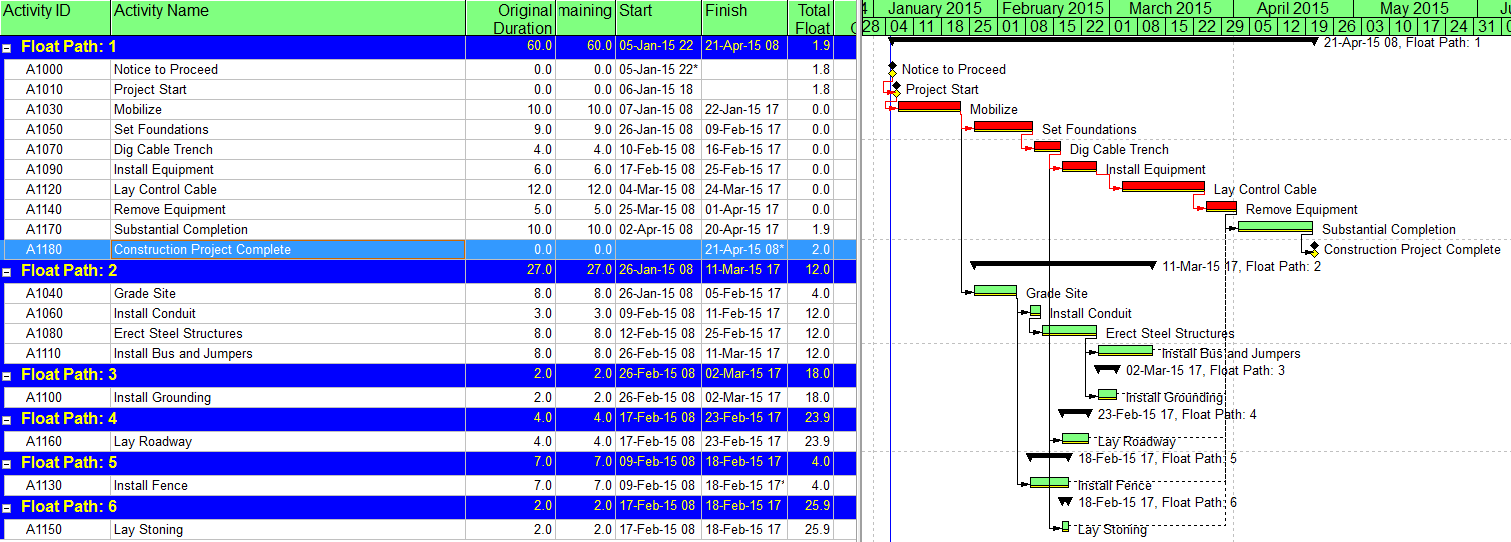
Figure 3: (P6) Multiple Float Paths to Interim Milestone
Unfortunately, P6 does not rigidly distinguish between driving-paths and near-driving paths. That is, while float path 1 is always “the” driving path, float path 2 may designate another, parallel driving path or a path that is 2 days from the driving path. It is not obvious how far a certain numbered path may be from driving; that is, what is its “relative float” with respect to the end activity? You can try to estimate this manually by looking at start and finish dates of various related activities in the output. More rigorously, the relative float of each path can be computed by summing the “Relationship Free Float” of all the relationships between the given path and the end activity. [Jul’18 Edit: In certain cases P6’s path-selection criteria can relegate parallel driving-path activities – even Longest-Path activities – to high-numbered float paths that appear far from the driving path. I described this in a later article – Relationship Free Float and Float Paths in Multi-Calendar Projects (P6 MFP Free Float Option).]
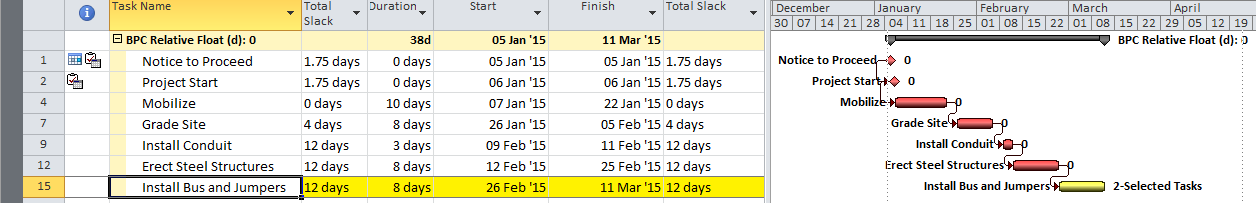
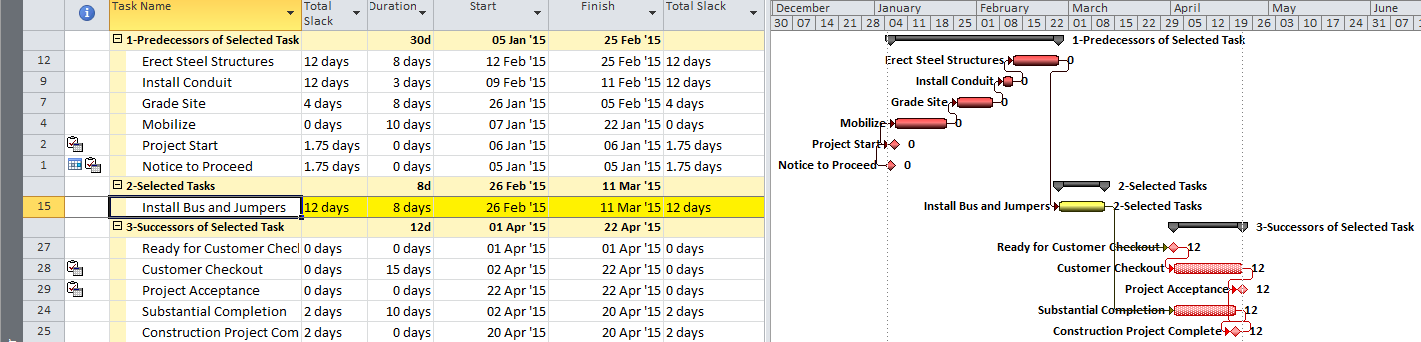
Ongoing management of projects often requires what-if analysis of prospective disruptions, and P6’s MFP can be useful. For example, the subcontractor for the “Install Bus and Jumpers” activity may request early access to accommodate a staffing conflict. Running MFP ending with “Install Bus and Jumpers” will identify the driving path of predecessors for this work (Figure 4), assisting in the review and consideration of the request.
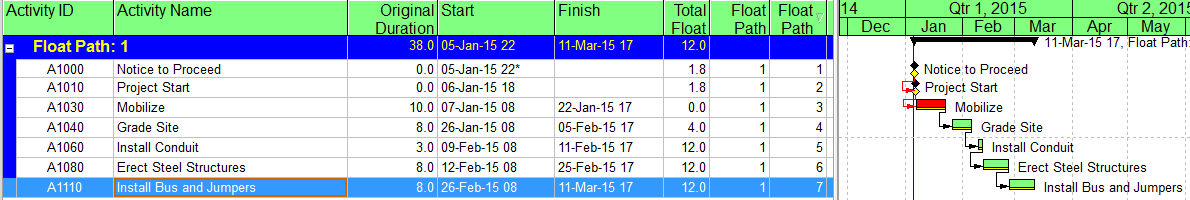
Figure 4 demonstrates the utter lack of correlation between Total Float and the driving logical path for any given activity in the schedule.
A Word about LOE Activities and ALAP Constraints (P6)
Depending on the scheduled dates, P6 automatically sets the relationships of LOE (level-of-effort) activities to “Driving”. As a consequence, P6’s Longest Path algorithm traces driving flags directly through LOE activities to their non-critical predecessors, and these end up – incorrectly – on the Longest Path. Fortunately, this error seems to be avoided in Multiple-Float Path analysis. MFP tracing correctly identifies only true driving logic and excludes LOE activities from the trace. (I’ve illustrated this in another entry HERE.)
Like LOEs, predecessor relationships from activities with ALAP (as-late-as-possible) constraints in P6 can be flagged as “Driving” based on their dates alone. Consequently, each ALAP-constrained predecessor creates a new parallel driving path to the selected end activity, and these paths are mapped in the MFP analysis. Since ALAP-constrained activities are rarely actually driving anything, it can be useful to filter them out from standard MFP layouts.
Multiple Float Path Analysis in Microsoft Project
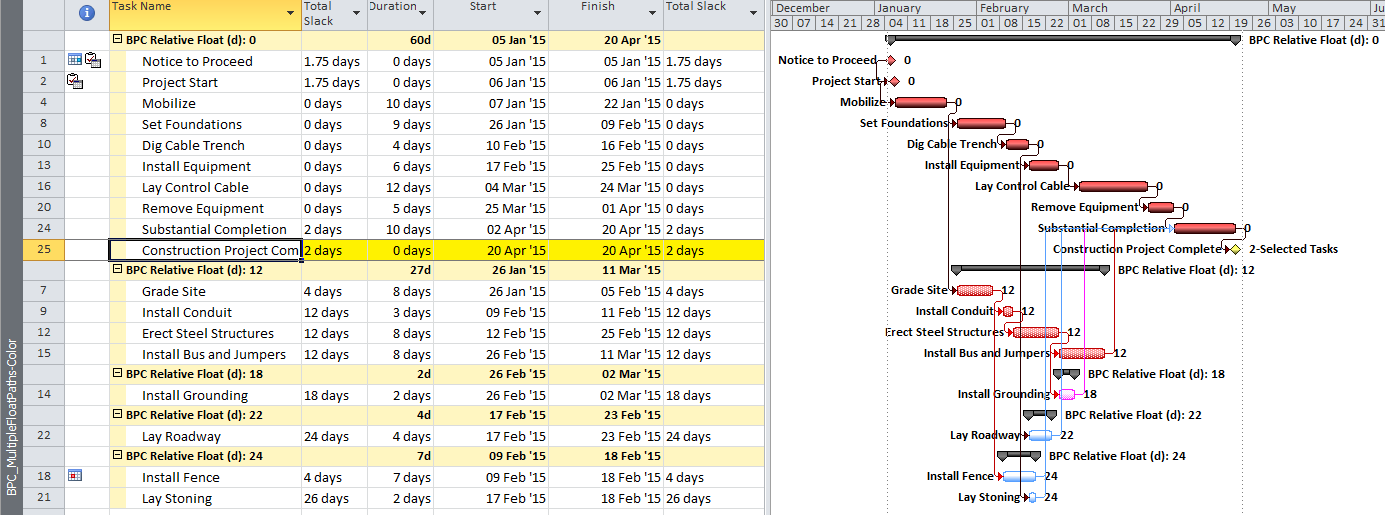
(Microsoft Project provides neither Longest-Path nor Multiple-Float-Path analysis. BPC Logic Filter is an add-in that applies similar calculations to MSP schedules.) Figure 5, Figure 6, and Figure 7 illustrate the same steps as above, but this time executed on the Microsoft Project version of the schedule using BPC Logic Filter. In this type of analysis, the primary difference between P6 and BPC Logic Filter is that BPC Logic Filter explicitly computes and displays “Relative Float” (i.e. days away from driving) for each path. Thus two logical paths with the same relative float (i.e. parallel paths) are grouped together in BPC Logic Filter, while P6 assigns separate float paths. The MSP add-in also re-colors Gantt bars based on their path relative float with respect to the “selected” task.
Finally, BPC Logic Filter allows a more substantial evaluation of the upstream and downstream logic affected by the potential change to “Install Bus and Jumpers”. Figure 8 identifies the predecessor and successor paths for the selected task, all arranged according to their path relative float (shown at the end of each bar) with respect to the selected task. This illustrates that, while the selected work cannot be accelerated without violating (or modifying) its driving predecessor logic, it may be delayed by up to 12 days without affecting any successor work.
As a long-time Primavera user accustomed to MFP analysis options, I was continually disappointed when faced with the need for logical path analysis in Microsoft Project. I wrote BPC Logic Filter in part to cover this gap; now I find myself facing disappointment in the opposite direction.