Simple Macro for Computing (Duration) Drag in MS Project

Here is the BFDDrag macro, which implements a brute-force technique to compute Critical Path Drag for all tasks in the active project.

Drag and Drag cost are two useful metrics in CPM scheduling that Stephen Devaux introduced in his book Total Project Control, but they are not widely computed or used.  Drag – coined as “Devaux’s Removed Activity Guage,” represents the individual contribution of any single schedule element (e.g. a task) to the overall duration of a project.  By definition, only “Critical Path” tasks have it, and a task’s Drag indicates the total theoretical project acceleration that could be gained if the task’s remaining duration were reduced to zero.  (Duration is not the only contributor to Drag – consider predecessor lags and constraints – but it is certainly the most prevalent.)

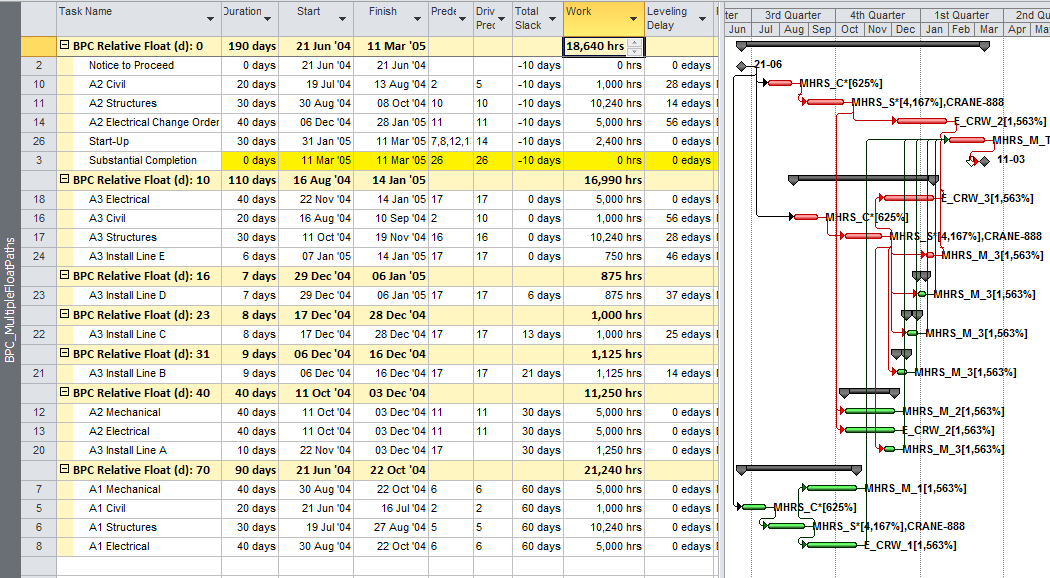
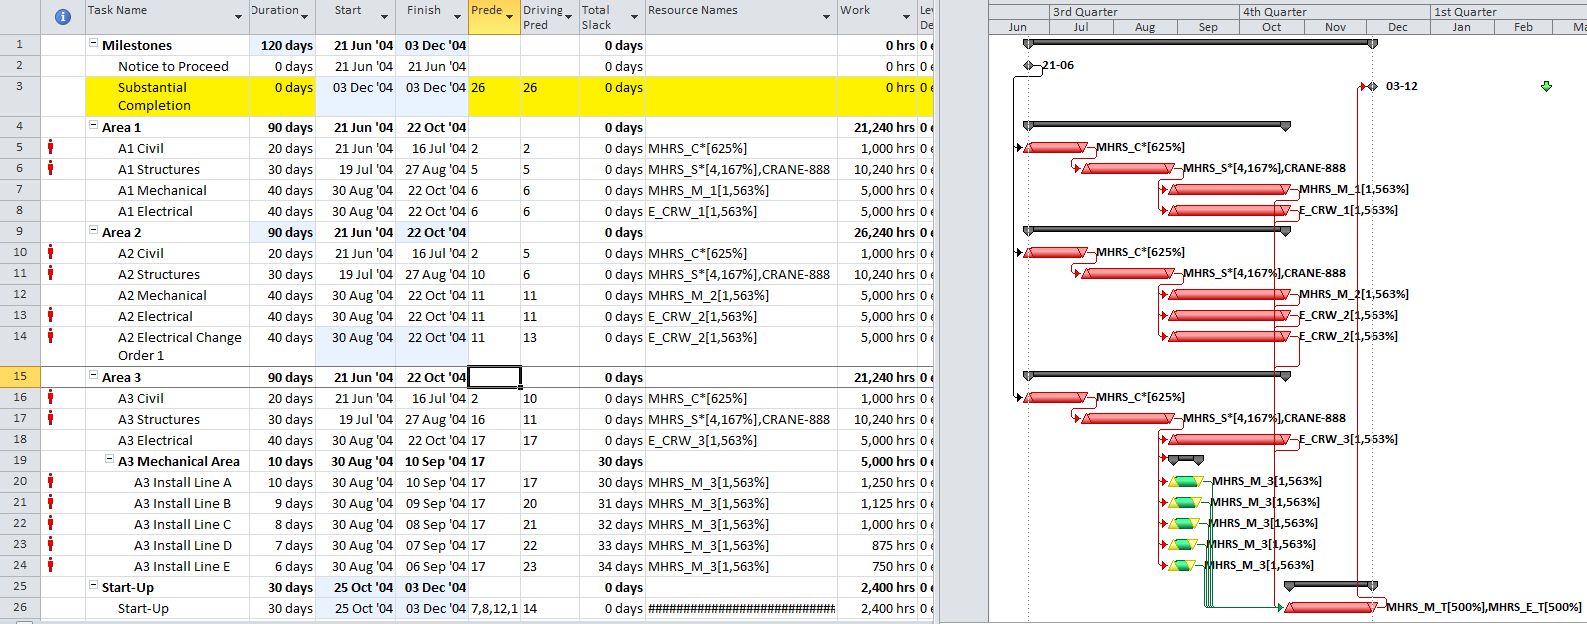
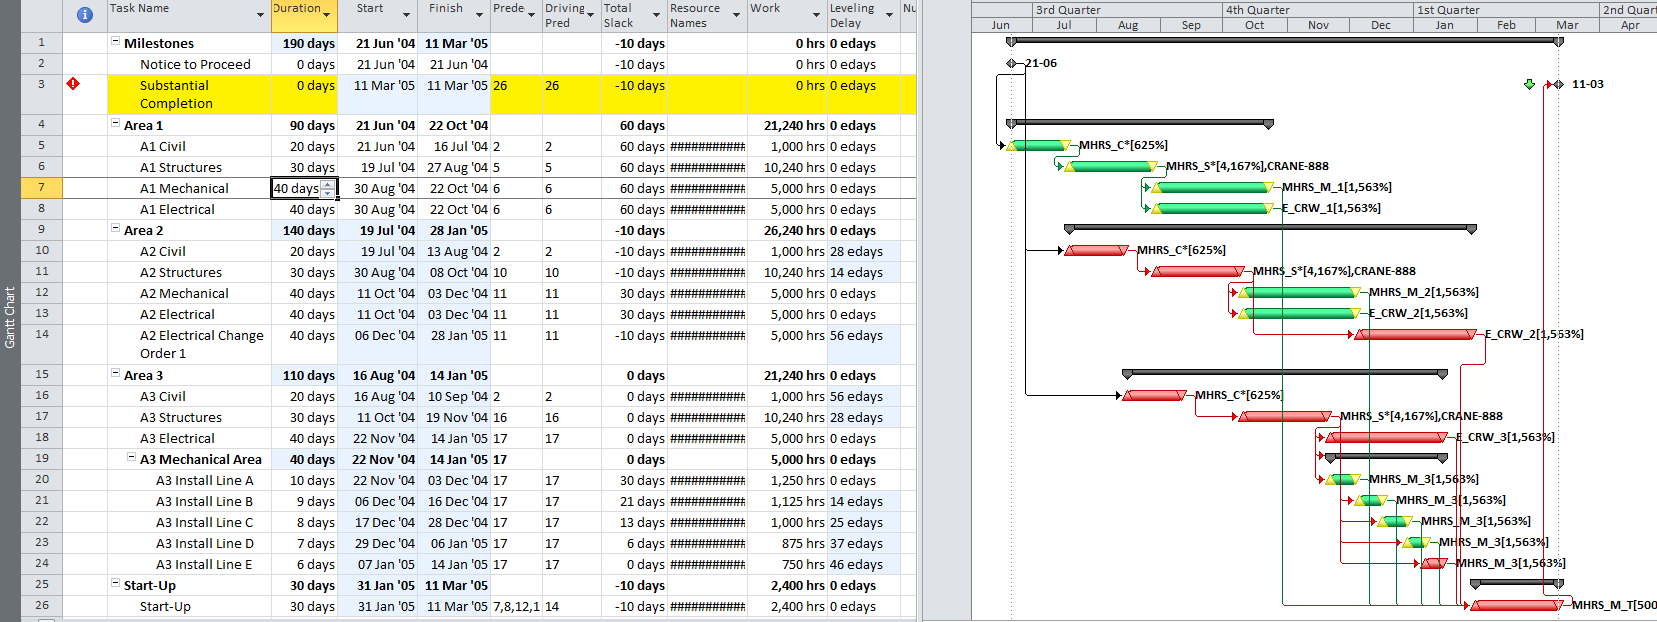
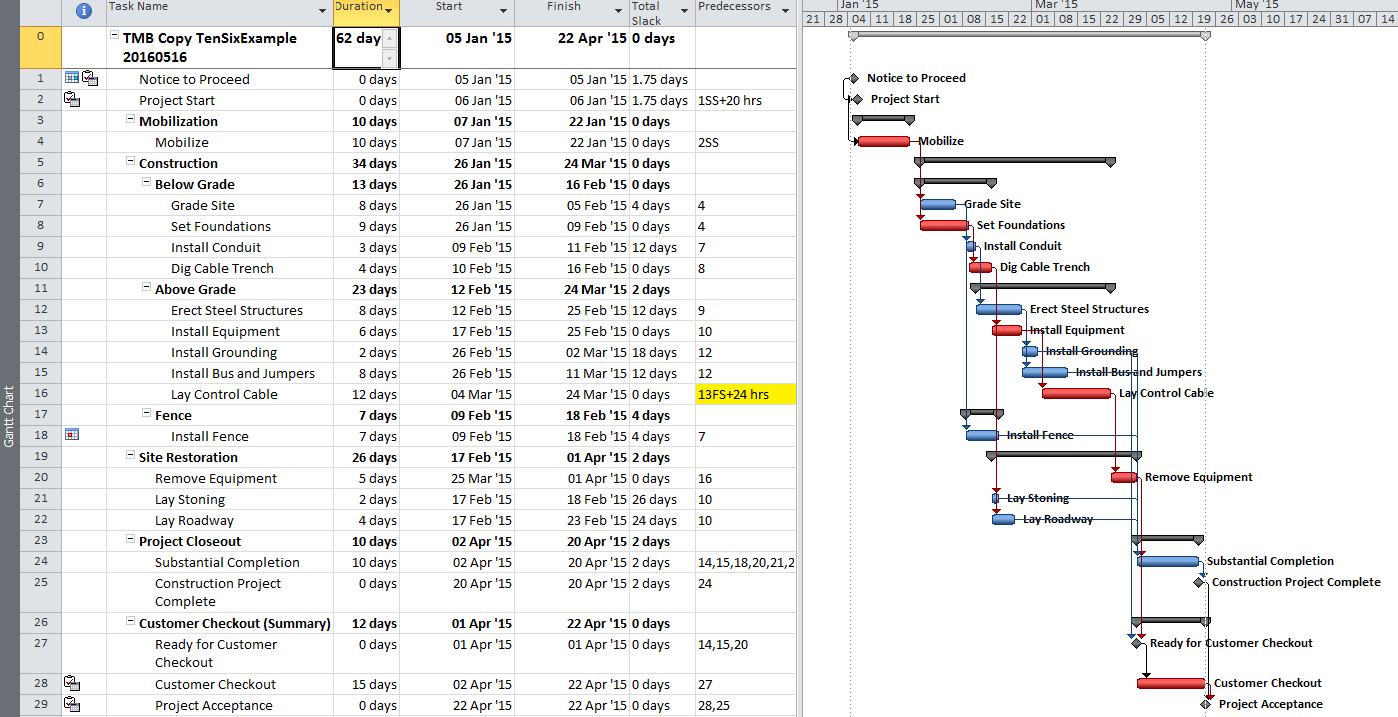
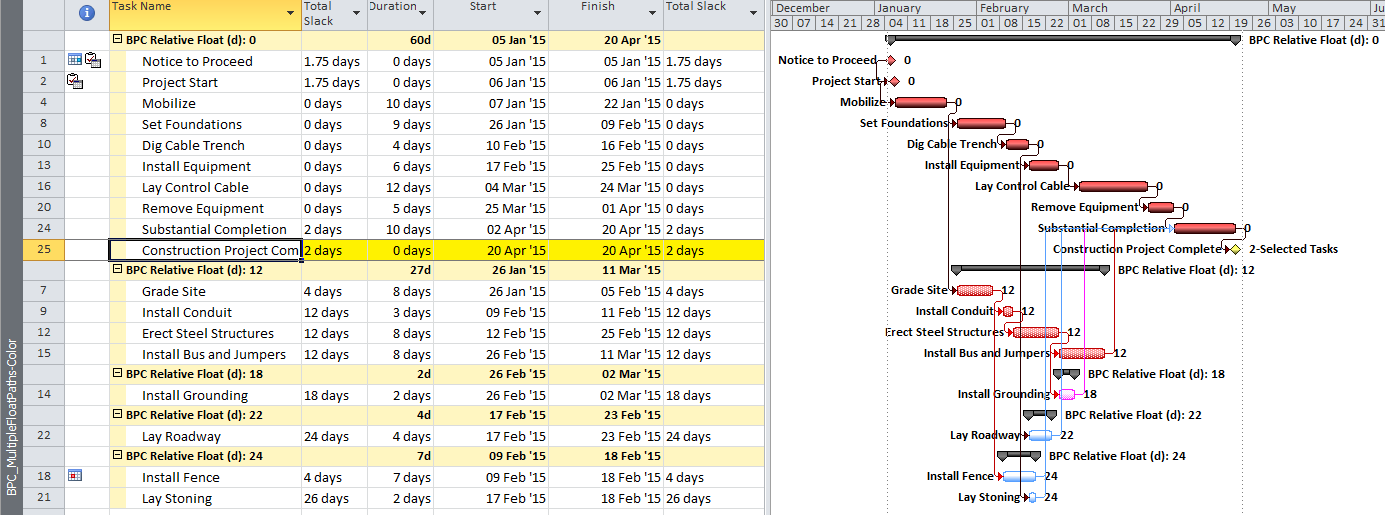
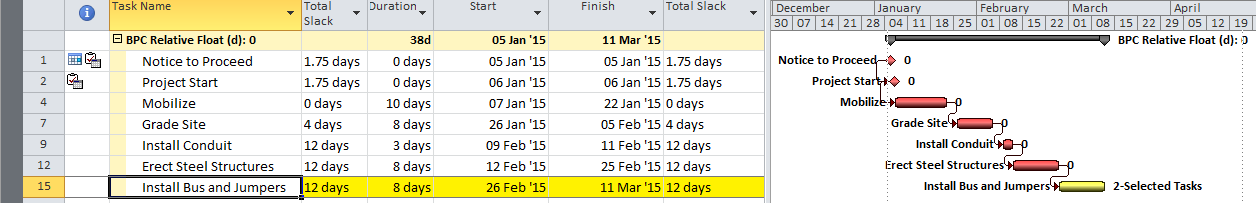
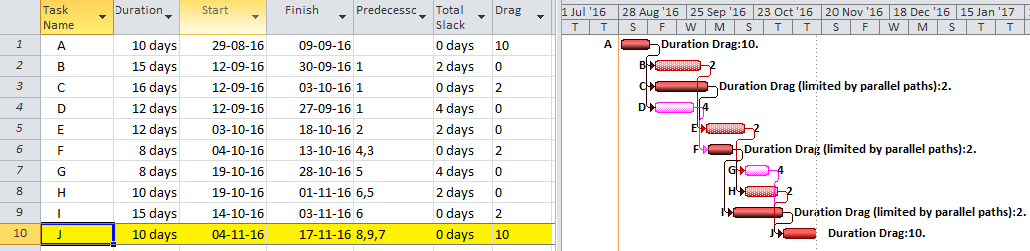
Drag can be useful in prioritizing activities for crashing (i.e. shortening) a project schedule.  Consider the simple project illustrated in Figure 1.  The “Critical Path” (ACFIJ – dark-red bars) is partially flanked by a near-critical path (BEH – hatched red bars) with a relative float (same as total slack here) of 2 days.  The overall project duration can be shortened by accelerating critical-path tasks, and most experienced schedulers would be tempted to first consider modifying the two longest critical tasks (C and I).  Accelerating either of them by more than two days yields no benefit, however, as the near-critical path then becomes Critical.  Drag indicates this limit for each task – not so obvious in complex project schedules – in advance.

Figure 1: NLD59DRAG1
Figure 1: Simple Drag Example

Below is a simple, brute force, macro for computing task drag (i.e. the drag of it’s duration) in Microsoft Project. The procedure cycles through each task in the project. If the task is a non-summary, incomplete task that is marked “Critical”, then the procedure sets its remaining duration to zero and measures the resulting acceleration (if any) of the project finish date. That value is stored in the Custom Field – “Duration5” as DRAG.  You’ll have to change this in the macro if “Duration5” is already in use.  I’ve also included a few comments in the code to guide you in modifying its scope.  The procedure is logged in the “Immediate” window of the Visual Basic editor.  After running this macro, Drag Cost could be separately computed for each task using a custom field formula that references the value in “Duration5”.

As noted, this is a “Brute Force” approach that relies on repetitive re-calculation of the CPM network by MSP’s scheduling engine.  At two calculation cycles for each critical task, it may take a long time to chug through a very large project, but it will get there eventually.  If your schedule has negative Total Slack, then MSP may interrupt the procedure to pop up a schedule warning window that you will need to click through (I have not added code to turn this warning off, but you can if you want).  This warning window may not always be visible if MSP is not the active application – you’ll need to click on it occasionally.


Sub BFDDrag()

'       Coded by Thomas Boyle, PE, PMP, PSP on 8Jan'16
'       This is a simple brute-force procedure to compute Duration DRAG (Devaux's Removed Activity Guage") for
'       each Critical task in the active project.  The procedure cycles through each task in the project.  If the task
'       is a non-summary, incomplete task that is marked "Critical", then the procedure sets its duration to zero and
'       measures the resulting acceleration (if any) of the project finish date.  That value is stored in the Custom
'       Field - "Duration5" as DRAG.  The procedure is logged in the "Immediate" window of the Visual Basic editor.

    Dim Tsk As Task, ODur As Double, OFin As Date, TDrag As Double
    Dim StartNote As String
    Dim Counter As Long
        
    Application.CalculateProject
    StartNote = ActiveProject.Name & vbCrLf & Now() & " Starting Drag Brute Force" & vbCrLf
    Counter = 0
        Debug.Print StartNote
    'OFin is the finish date to be tested.  Default is the Project Finish.
    OFin = ActiveProject.ProjectFinish
    
    'Default computes DRAG for each task in ActiveProject.  To compute only for selected tasks,
    'then change "ActiveProject.Tasks" to "ActiveSelection.Tasks"
    For Each Tsk In ActiveProject.Tasks
        If Not Tsk Is Nothing Then
            If Tsk.Summary = False And Tsk.PercentComplete <> 100 Then
                Tsk.Duration5 = 0
                Counter = Counter + 1
                Debug.Print Counter & "Checking Task: " & Tsk.ID & " " & Tsk.Name
                
                If Tsk.Critical = True Then
                    If Tsk.Duration > 0 Then
                        ' Remove Task Duration and Check Finish Date
                        ODur = Tsk.Duration
                        Tsk.Duration = Tsk.ActualDuration
                        Application.CalculateProject
                        If Application.DateDifference(ActiveProject.ProjectFinish, OFin) > 0 Then  'Decreasing Normal Critical case
                            TDrag = Application.DateDifference(ActiveProject.ProjectFinish, OFin)
                        Else    'Decreasing Neutral or Reverse Critical case (Zero Drag)
                            'Test for Increasing Reverse Critical Case
                            Tsk.Duration = ODur + 1 'Adding one minute to Duration
                            Application.CalculateProject
                            If Application.DateDifference(ActiveProject.ProjectFinish, OFin) > 0 Then
                                'Increasing Reverse Critical case
                                TDrag = -1 * 5 'INDICATOR ONLY. Need further testing to find limit
                            Else
                                TDrag = 0
                            End If
                        End If
                        Debug.Print "Drag = " & TDrag / 60 / ActiveProject.HoursPerDay & "Days"
                        Tsk.Duration5 = TDrag
                        Tsk.Duration = ODur
                        Application.CalculateProject
                    End If 'Positive Duration

                Else
                    Debug.Print "Non-Critical"
                End If 'Critical Task Check DRAG
            End If 'Summary=No
        End If 'Not Nothing
    Next Tsk
    
    Debug.Print "Previous: " & StartNote
    Debug.Print Now(), "Finished Drag Brute Force"

End Sub

I started to include Lag Drag in the procedure, but modifying the lag value through code is a little more complicated.  That will have to wait for another time.

I originally wrote a version of this brute-force macro to test the performance of the drag computations in BPC Logic Filter.  Unfortunately, although BPC Logic Filter runs much, much faster for larger networks, it can fail to catch the Drag limitations caused by early start constraints and task calendar changes away from a given task.  This simple macro is still the standard (for incomplete tasks).

[20Jan’16 – Edited code to catch “negative” drag for “reverse-critical” tasks.  These are rare critical-path tasks that include a reverse flow of driving logic.

22Jan’16 – Further code edit to zero-out negative drag for all except the singular case where increasing task duration shorten’s the project.  In that case, the code leaves a value of -0.01 days as an indicator only.]

[This macro computes Drag only with respect to the overall completion of the active project, not any specific completion milestone, and it uses the active project’s default calendar for quantifying Drag.  If your true Critical Path is defined by some completion milestone that is not the last task in the project, then you will need a more powerful tool.  This video demonstrates Drag calculation in BPC Logic Filter.]


Resource Leveling Breaks the “Critical Path” – Logic Analysis of Resource-Leveled Schedules (MS Project)

[31Mar’16: The latest release of BPC Logic Filter now includes resource leveling constraints in the logical path analysis.  I’ve written another article to summarize and amend this one:  The Resource Critical Path – Logic Analysis of Resource-Leveled Schedules (MS Project), Part 2 .]

Effective management of resources – i.e. planning, procuring, mobilizing, and deploying – is a core competency for successful companies in project-focused industries like construction.  Most scheduling tools based on the Critical Path Method (CPM) – like Microsoft Project – can generate project schedules without resources, but they also include methods for assigning, analyzing, and “leveling” project resources.  In this context, “leveling” means selectively delaying some work (compared to the CPM-based schedule) pending the completion of other, more urgent works that demand the same resources.

This simple description might imply that a certain logical/sequential relationship is imposed between two competing tasks (i.e. the “less urgent” work can only start after the “more urgent” work is finished with the resources) – sometimes called “soft logic”.  Unfortunately, the leveling engine in Project 2010 does not appear to use, much less preserve, any such soft logic.  Consequently, logical analysis of the leveled schedule – including interpretation of Total Slack to determine critical path or driving logical path – appears invalid.

Figure 1: Simple Construction Project with Resource Loading

Figure 1 is a simplified CPM model of a construction project involving multiple trades working in multiple areas.  The model includes realistic resource loading, but the logical links have been limited to “hard logic” only (i.e. physical constraints).  In other words, there is no preferential logic to guide the resource deployments.  The default 5dx8h weekly calendar is universally applied, and a deadline of 25Feb’04 has been imposed.  The unleveled CPM schedule includes a forecast completion that is nearly 3 months ahead of the deadline, but resources are severely over-allocated – the schedule appears unrealistic and needs to be leveled.

Specifically:

  1. Three civil works tasks are running concurrently, but there is only sufficient manpower to run them sequentially. (Figure 2.)
  2. Three structural tasks are also running concurrently, and these require both manpower (Figure 3) and a crane (Figure 4), which is the limiting resource. They must be done sequentially.
  3. There is room to install the five separate processing lines concurrently in Area 3, but there is only enough skilled manpower to install them one at a time. (Figure 5).
  4. An electrical change order has been approved in Area 2, but this requires the same specialized crew that is already working there. The Change-order work must be delayed (Figure 6).
Figure 2: Over-Allocation of Civil Works Manpower
Figure 3: Over-Allocation of Structural Erection Manpower
Figure 4: Over-Allocation of Crane
Figure 4: Over-Allocation of Crane for Structural Erection
Figure 5: Over-Allocation of Mechanical Installation Manpower
Figure 5: Over-Allocation of Area 3 Specialized Mechanical Installation Manpower
Figure 6: Over-Allocation of Specialized Electrical Manpower
Figure 6: Over-Allocation of Area 2 Specialized Electrical Manpower

It is a simple matter to remove the over-allocations by manually executing Project’s leveling engine using near-default conditions (Figure 7).

Figure 7: Resource Leveling Options

The leveling engine resolves the over-allocations by selectively delaying those tasks (and task resource assignments, if specified) which are judged to be lower-priority according to Project’s proprietary rules.  Figure 8 illustrates the results of the leveling exercise:

Figure 8: Resource-Leveled Schedule
  1. The primary artifact of the leveling process is the “leveling delay” task property, which is in units of elapsed-duration (i.e. “edays”). The leveling delay is incorporated into the forward-pass schedule calculation, pushing the early start dates of the affected tasks.  (Separate leveling delays can also be applied to resource assignments, which can extend task durations.  This has not been done here and is generally not recommended when assigned resources are expected to work concurrently – e.g. Crane and structural erection crew.)  Leveling delay is also incorporated into the backward pass, removing “phantom slack” from logically-connected tasks.
  2. Through the task leveling delay, the civil, structural, mechanical, and electrical tasks have been re-scheduled sequentially.
  3. Substantial Completion has been delayed until two weeks after the deadline, resulting in 10 days of negative slack on the milestone and its logical driving predecessors.
  4. There is not an obvious (-10d) total-slack path from beginning to end of the project.

Figure 9 illustrates the use of BPC Logic Filter to determine the driving path logic of the Substantial Completion task after leveling.  The driving path is comprised of four tasks and two milestones separated by gaps, and the intervals of the gaps are determined by the “leveling delay.”  Unfortunately, this does not describe a “resource constrained critical path.”  In fact, the obviously critical tasks without leveling delay – including the first (i.e. “A1”) Civil and Structural works and the A2 Electrical works – now have high values of total slack and are shown far from the critical path.  Consequently, it is clear that logical path analysis – including any evaluation of Total Slack – is not consistent with the rule-based resource leveling algorithm used by Microsoft Project.

Figure 9: Logic Analysis of Leveled Schedule

Figure 10 illustrates the un-leveled schedule, revised to include obvious preferential logic for avoiding resource conflicts.  The resulting task sequences and schedule dates are identical to those of the leveled schedule seen earlier, but the associated total slack values and “critical” flags are substantially different.  As shown in Figure 11, however, the logic paths are clear and consistent with the real resource constraints of the project.  The “BPC Relative Float (d): 0” group appears to represent the true resource constrained critical path for the project.

Figure 10: Preferential (Soft) Logic in Unleveled Schedule
Figure 11: Logic Analysis of Unleveled Schedule with Preferential Logic

To recap, Microsoft Project’s proprietary resource leveling engine offers a convenient tool for resolving resource conflicts in project schedules, and this functionality seems heavily used and highly valued in some industries.  It does not appear appropriate, however, for use in complex projects where formal logical sequencing of tasks – including identification of Critical Path or Critical Chain – is required. In particular, Project’s “Critical” flag will fail to accurately mark the critical path in a resource-leveled schedule.   Consequently, a project specification that requires both a logic-driven schedule basis and heuristic resource leveling appears contradictory.

[Click here to proceed to the follow-up article:  The Resource-Constrained Critical Path – Logic Analysis of Resource-Leveled Schedules (MS Project), Part 2 .]

Beyond the Critical Path – the Need for Logic Analysis of Project Schedules

This entry is intended to review the use of the Multiple Float-Path calculation option in Primavera Project Management (P6) and to offer a brief example of its use compared to BPC Logic Filter (for Microsoft Project).

Project schedules generated using the Critical Path Method (CPM) are commonly used to model – and to document – the project team’s plan for executing the scope of work.  Such a plan normally involves identifying necessary activities at an appropriate level of detail and specifying the necessary sequential relationships between them.  The output from the CPM analysis is a list of activities with associated durations, dates, and float values – this constitutes “the schedule”.

Unfortunately, the sequential relationships that ultimately drive the schedule (i.e. the logical “plan”) can be difficult to communicate or analyze for all but the simplest projects.  This is because Total Float – the telltale indicator of logical-path connectivity in simple projects – becomes unreliable (or unintelligible) for such purposes in the presence of variable activity calendars or late constraints.  As a result, complex schedule models lose both usefulness and credibility among project stakeholders unless schedule managers go beyond the simple communication of dates, durations, and float.

Multiple Float Paths

Oracle’s Primavera P6 software (P6) has always included an option to compute “Multiple Float Paths” when calculating the schedule, but many experienced planners seem unfamiliar with it.  The option facilitates the identification of the “driving” and “near-driving” logical paths for a single selected activity.  The selected activity can be a key project milestone that may or may not correspond to the end of the project, or it may be a simple intermediate activity of particular or urgent concern.

Figure 1 represents a simple project for construction and handover of a small utility installation – originally modeled in Microsoft Project and then converted to Primavera P6.  (The model was developed primarily for illustrating the impact of calendars and constraints; the work techniques illustrated are neither typical nor ideal.)

  • There are contractually-derived late-finish constraints on the Construction Project Complete milestone (24Apr’15) and the final Project Acceptance milestone (29Apr’15). These constraints affect the late dates (and consequently Total Float) for these activities and (parts of) their chains of predecessors.
  • There is a late-finish constraint (25Feb’15) on the “Install Fence” activity (reason not known), with similar impacts on late dates and Total Float.
  • Activities are scheduled using a 4d x 8h work week (M-Th), except for the two initial milestones which utilize a 24-hour calendar, and the final two Customer Checkout activies which utilize a 5d x 8h workweek.
  • The “Notice to Proceed” milestone is constrained to start no earlier than 10:00 PM on 05Jan’15.
  • P6’s scheduling options are set to define critical path activities on the basis of “Longest Path” rather than Total Float, and the Gantt chart appears to properly display the Critical Path by this definition. Thus, the two initial milestones are marked as critical because they are driving the project’s completion, even though their calendars allow a higher value for total float.
Figure 1: (P6) Simple Construction/Handover Project

Although “Longest Path” appears to correctly identify the driving path to the project completion (the Project Acceptance milestone), the contractor is equally interested in identifying the driving path to the “Construction Project Complete” intermediate milestone.

In P6’s advanced schedule options, we select “calculate multiple float paths” ending with the “Construction Project Complete” milestone” (Figure 2).  As a rule, we calculate the multiple paths using “free float” rather than “total float”, since the former option best mimics “longest path” behavior.*  The default number of paths to calculate is ten.

* See “P6-multiple-float-path-analysis-total-float-and-free-float-options” for more on these options.

Figure 2: (P6) Schedule Option for Multiple Float Paths

Figure 3 illustrates the result of re-calculating the schedule then displaying a layout that arranges the activities by “Float Path” and sorting by “Float Path Order”.  In this figure, “Float Path 1” is the driving logical path leading to the Construction Project Complete milestone.  “Float Path 2” defines the first near-driving-path, “Float Path 3” defines the next near-driving path, etc.  Each “float path” is essentially a discrete branch from the main, driving logical path.  Obviously, Float Path 1 defines the activities that offer the most opportunity to accelerate the construction project (and maybe the most risk of extending it.)  According to the figure, higher float paths tend to have higher values of total float, though the correlation is not universal.

Figure 3: (P6) Multiple Float Paths to Interim Milestone

Unfortunately, P6 does not rigidly distinguish between driving-paths and near-driving paths.  That is, while float path 1 is always “the” driving path, float path 2 may designate another, parallel driving path or a path that is 2 days from the driving path.  It is not obvious how far a certain numbered path may be from driving; that is, what is its “relative float” with respect to the end activity?  You can try to estimate this manually by looking at start and finish dates of various related activities in the output.  More rigorously, the relative float of each path can be computed by summing the “Relationship Free Float” of all the relationships between the given path and the end activity.  [Jul’18 Edit:  In certain cases P6’s path-selection criteria can relegate parallel driving-path activities – even Longest-Path activities – to high-numbered float paths that appear far from the driving path.  I described this in a later article – Relationship Free Float and Float Paths in Multi-Calendar Projects (P6 MFP Free Float Option).]

Ongoing management of projects often requires what-if analysis of prospective disruptions, and P6’s MFP can be useful.  For example, the subcontractor for the “Install Bus and Jumpers” activity may request early access to accommodate a staffing conflict.  Running MFP ending with “Install Bus and Jumpers” will identify the driving path of predecessors for this work (Figure 4), assisting in the review and consideration of the request.

Blog151226Fig4
Figure 4: (P6) Multiple Float Path to Install Bus and Jumpers

Figure 4 demonstrates the utter lack of correlation between Total Float and the driving logical path for any given activity in the schedule.

A Word about LOE Activities and ALAP Constraints (P6)

Depending on the scheduled dates, P6 automatically sets the relationships of LOE (level-of-effort) activities to “Driving”.  As a consequence, P6’s Longest Path algorithm traces driving flags directly through LOE activities to their non-critical predecessors, and these end up – incorrectly – on the Longest Path.  Fortunately, this error seems to be avoided in Multiple-Float Path analysis.  MFP tracing correctly identifies only true driving logic and excludes LOE activities from the trace.  (I’ve illustrated this in another entry HERE.)

Like LOEs, predecessor relationships from activities with ALAP (as-late-as-possible) constraints in P6 can be flagged as “Driving” based on their dates alone.  Consequently, each ALAP-constrained predecessor creates a new parallel driving path to the selected end activity, and these paths are mapped in the MFP analysis.  Since ALAP-constrained activities are rarely actually driving anything, it can be useful to filter them out from standard MFP layouts.

Multiple Float Path Analysis in Microsoft Project

(Microsoft Project provides neither Longest-Path nor Multiple-Float-Path analysis.  BPC Logic Filter is an add-in that applies similar calculations to MSP schedules.)  Figure 5, Figure 6, and Figure 7 illustrate the same steps as above, but this time executed on the Microsoft Project version of the schedule using BPC Logic Filter.  In this type of analysis, the primary difference between P6 and BPC Logic Filter is that BPC Logic Filter explicitly computes and displays “Relative Float” (i.e. days away from driving) for each path.  Thus two logical paths with the same relative float (i.e. parallel paths) are grouped together in BPC Logic Filter, while P6 assigns separate float paths.  The MSP add-in also re-colors Gantt bars based on their path relative float with respect to the “selected” task.

Figure 5: (MSP) Simple Construction/Handover Project
Figure 6: (MSP) BPC Logic Filter – Multiple Float Paths to Interim Milestone
Figure 7: (MSP) BPC Logic Filter – Driving Path to Install Bus and Jumpers

Finally, BPC Logic Filter allows a more substantial evaluation of the upstream and downstream logic affected by the potential change to “Install Bus and Jumpers”.  Figure 8 identifies the predecessor and successor paths for the selected task, all arranged according to their path relative float (shown at the end of each bar) with respect to the selected task.  This illustrates that, while the selected work cannot be accelerated without violating (or modifying) its driving predecessor logic, it may be delayed by up to 12 days without affecting any successor work.

Figure 8: (MSP) BPC Logic Filter – Driving and Driven Paths for Intermediate Activity (Install Bus and Jumpers)

As a long-time Primavera user accustomed to MFP analysis options, I was continually disappointed when faced with the need for logical path analysis in Microsoft Project.  I wrote BPC Logic Filter in part to cover this gap; now I find myself facing disappointment in the opposite direction.

Simple Macro for Listing Driving Predecessor(s) in MS Project

The Drivers macro reads and copies the ID of each task’s driving predecessors into a custom text field for the task.

One of the missing features for anyone coming to MSP from Primavera’s planning tools is the little mark designating the driving predecessor(s) in the predecessors list for each activity.

MS Project 2010+ kind of addresses this with a feature called “Task Inspector” that opens a pane and displays some scheduling factors affecting the selected task.  One of the factors displayed is the “Predecessor Tasks:” table, which lists the predecessor(s) (if any) that limit the early start date of the selected task.  The driving predecessor is inserted as a link, so it is possible to jump backwards through the driving logic of the schedule.

Since I use BPC Logic Filter, I haven’t had much use for Task Inspector.  Still, it is occasionally useful to see a long list of predecessors and know immediately which ones are driving the selected task.  Here is a little macro to copy the IDs of the driving predecessors into the “Text2” field of each task.

Sub Drivers()

    Dim t As Task
    Dim td As TaskDependency
    Dim PredDr As String
    Dim i As Integer
    
    
    For Each t In ActiveProject.Tasks
        If Not t Is Nothing Then
            PredDr = ""
            i = 0
        
            For Each td In t.StartDriver.PredecessorDrivers
                i = i + 1
                If i = 1 Then
                    PredDr = PredDr & td.From.ID
                Else
                    PredDr = PredDr & "," & td.From.ID
                End If
            Next td
            
            t.Text2 = PredDr
        End If
    Next t

End Sub

The user can then insert the “Text2” column in any task view.  The image at the top of the post is a little schedule with the column inserted as shown and named “Driving Pred”.

The “Drivers” determination is done by MSP’s scheduling engine, and I have found it to be unreliable for driving predecessors that are not Finish-to-Start links.  (Problems with Driving Logic in Task Inspector and Task Paths – Microsoft Project 2010-2016)  Nevertheless, it’s better than nothing.  Obviously, the macro needs to be re-run whenever the logic or task numbering changes….

If you are interested in a real logic trace of the driving path for the activity, then you’ll need a much more sophisticated macro (like this one) or a full-fledged Add-In like BPC Logic Filter – shown in this video.    As a side feature, BPC Logic Filter includes a task Logic Inspector that displays driving and non-driving relationships for any task.  Visit the BPC Logic Filter page to download a fully-functioning Trial version.


Monitoring Near Critical Tasks in Microsoft Project

Here I address the fundamental inability of MSP users – even supposed experts – to correctly analyze a logic-driven schedule.

While rooting around Planning Planet this morning, I stumbled across this link to an 8-month old blog entry from Ten Six Consulting: Monitoring Near Critical Tasks in Microsoft Project 2013 | Ten Six Consulting.  In light of my work on BPC Logic Filter, this was a subject of interest to me.  I started to reply on PP, but as my response grew I decided to transform it into an entry over here….

Overall I believe the article presents a perfect example of the fundamental inability of MSP users – even supposed experts – to correctly analyze a logic-driven schedule.  The primary reason for this is the user community’s reliance on Total Slack as the sole indicator of a given task’s “criticality” or its inclusion on a particular logical path – all while continuing to use constraints, deadlines, and variable calendars.

As usual, the article is a well written and nicely presented illustration of a fairly elementary concept, i.e. generating and applying a “Near Critical Filter” to show only tasks with Total Slack values between 0.1 and 10 days.  Ten Six then applied this filter to “clearly see all the tasks that are non-critical but in danger of becoming critical if they are delayed in any way.”  Here is the resulting chart (taken from their article) with the four “Near Critical” tasks highlighted.  The chart implicitly tells us that a Finish-No-Later-Than (2/22/15) constraint has been applied to the “Install Fence” task, reducing its Total Slack to 4 days.  Now the Fence and its only predecessor (Grade Site) are highlighted as Near-Critical.  (The TS=2 on the “Above Grade” summary task, also highlighted, seems to be a fluke of MSP’s screwy roll-up rule for TS; it reflects no logical relationship. [See Total Slack Calculation for Summary Tasks in Microsoft Project.])

Near-Critical-Tasks-in-Microsoft-ProjectFig-7

So, if the fence is delayed by 5 days, is the project’s completion delayed?  Clearly No; not according to this schedule.  The fence is not Near Critical for the project.  It merely has a constraint that may be violated (generating negative slack) if it slips too much.  Since it is a common practice to represent such commitments with late constraints or deadlines, this example is fairly typical of a situation that occurs routinely in complex schedules with multiple contract milestones.  It demonstrates why total slack is an unreliable indicator of the critical/near-critical path – i.e. the driving/near-driving path for project completion (or for anything else) –for all but the simplest projects.

There are some traditionalists in the scheduling profession who aim to preserve the sanctity of Total Slack (and Total Float in other tools) by prohibiting the use of any deadlines or late constraints in the schedule at all, regardless of contract commitments.  The same group should also prohibit the use of variable task calendars, resource calendars, and any kind of resource leveling, since these can also invalidate their interpretation of total slack.  I understand and empathize with this point of view – after all, without meaningful Total Slack (especially in MSP), the typical planner or analyst is reduced to hand-waving explanations when it comes to answering the tough questions.  I’ve been there.  Nevertheless, I also think alarm bells should ring and the schedule should bleed red whenever there is a forecast failure to meet a commitment.  I advocate for methods other than setting aside 30 years of software development.

I spent a few minutes duplicating Ten Six’s schedule in MSP 2010 – thankful that they seem to be using the same (standard) example for the two articles published eight months apart.  I think I got it close enough for illustrative purposes – with the main factors being a 4-day project work-week (M-Th), a 24-hour calendar on the first two milestones, and the aforementioned late constraint on the fence.  Then I used BPC Logic Filter to trace the logic for the “Project Complete” task.

Here’s the resulting chart.  It shows the driving path for project completion (i.e. the “Critical Path”) – at Relative Float of 0.  The CP includes all the tasks with TS=0 plus the two project milestones which, because of their different calendars, have a different Total Slack value.  The first “Near-Critical Path” is actually 12-days (not 4 days) away from driving the project completion, and it includes the “Grade Site” task with the (synthetically reduced) TS=4.  The “Install Fence” task, also with TS=4, is 24 days away from driving the project completion.

TMB Copy TenSixExample 20150130-20150821

I didn’t write BPC Logic Filter to overcome all the shortcomings of MSP; rather I wrote it to extract and present the logic-related information that is already there but which MSP does not show.  In this case – as in most – it tells a more complete story than Total Slack alone.