I finally got around to making a video of BPC Logic Filter’s Drag calculation in action.
Tag: Critical Path Drag

Musings on Critical Path Drag and Calendars in CPM Schedules
As is the case for Total Float/Slack, introducing variable task calendars can significantly confuse the understanding of Critical Path Drag in Project Schedules.
[See also Simple Macro for Computing (Duration) Drag in MS Project and
Video – Compute Critical Path Drag in Microsoft Project]
Critical Path Drag is a useful metric in CPM scheduling that Stephen Devaux introduced in his book Total Project Control, but it is not widely computed or used. Drag represents the individual contribution of any single schedule element (e.g. a task) to the overall duration of a project. By definition, only “Critical Path” tasks have it, and a task’s Drag indicates the total theoretical project acceleration that could be gained if the task’s remaining duration were reduced to zero. Viewed simplistically another way: if Total Float/Slack represents how much a non-critical task may slip before becoming Critical; Critical Path Drag represents how much a Critical task may be compressed* before becoming non-Critical. This can be very useful in focusing a project acceleration (e.g. Crashing) exercise.
It’s clear that theoretically many components in a CPM schedule can possess Drag: activity durations, early constraints, and predecessor lags to start with. Activity calendars can also possess Drag. I originally incorporated Drag analysis into BPC Logic Filter with the aim of correctly analyzing the Drag possessed by each component, but I recently decided to at least temporarily set aside that idea for the following reasons:
- Drag seems so rarely used in practice that using even a single number for each activity is a stretch for the typical user; parsing it out to its many components seems unhelpful to most.
- Allocating Drag purely by passive network analysis is hard.
- Most importantly, other Drag-computing software (namely Spider and Asta) seem to compute only a single figure for each activity. Allocating Drag to different components could conflict with these single-value metrics under some circumstances, leading to confusion and possible loss of confidence in the tool.
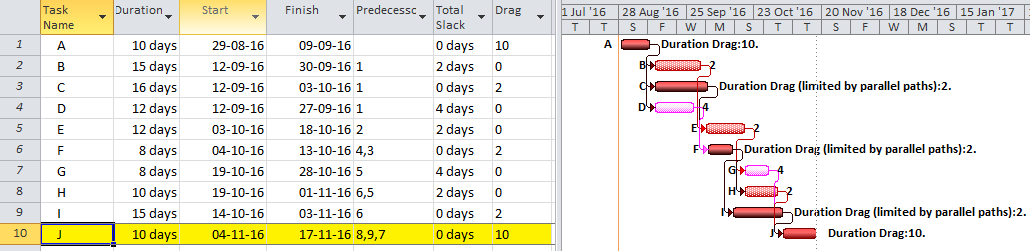
Now BPC Logic Filter provides an option to compute a single driving path Drag number for each task included in a logical analysis – using a brute-force, remove-and-recalculate approach. This Drag reflects the maximum acceleration of the project’s completion milestone (or any other selected milestone or task in the project) to be gained by modifying the task’s duration alone. A negative value indicates that the project is shortened by lengthening a particular task – this is reverse logic flow.
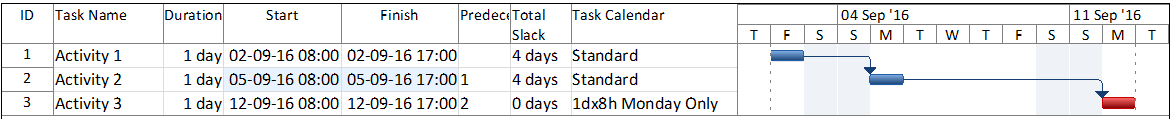
As is the case for Float/Slack, introducing variable task calendars can significantly confuse the understanding of Drag. Consider a simple project comprising three 1-day tasks in sequence, beginning on a Friday and with the first two tasks assigned the “Standard” calendar, i.e. 5dx8h. The concluding task “Activity 3” (perhaps a management task) is on a “Monday-Only” calendar.** As shown in the figure below, Activity 3 is scheduled to complete on the second Monday.*** Clearly, removing the duration of Activity 1 (or 2) will accelerate the Completion Task – Activity 3 – by seven calendar days, from the second Monday to the first Monday.
So what is the Drag of Activity 1? As shown by the combined figures below, the answer depends on the calendar used to quantify the acceleration. Measured according to Activity 1’s own calendar, a Monday-to-Monday acceleration is 5 days – indicating 5 days of Drag. That same Monday-to-Monday acceleration is only 1 working day according to the calendar of the Completion Task – resulting in 1 day of Drag. Using the Project’s overall calendar could provide different results altogether. For Activity 3 of this example, the Project Calendar is neither the Local Task Calendar nor the calendar of the Completion Task (also Activity 3); then it becomes like the first two tasks with a Drag of 5 days.
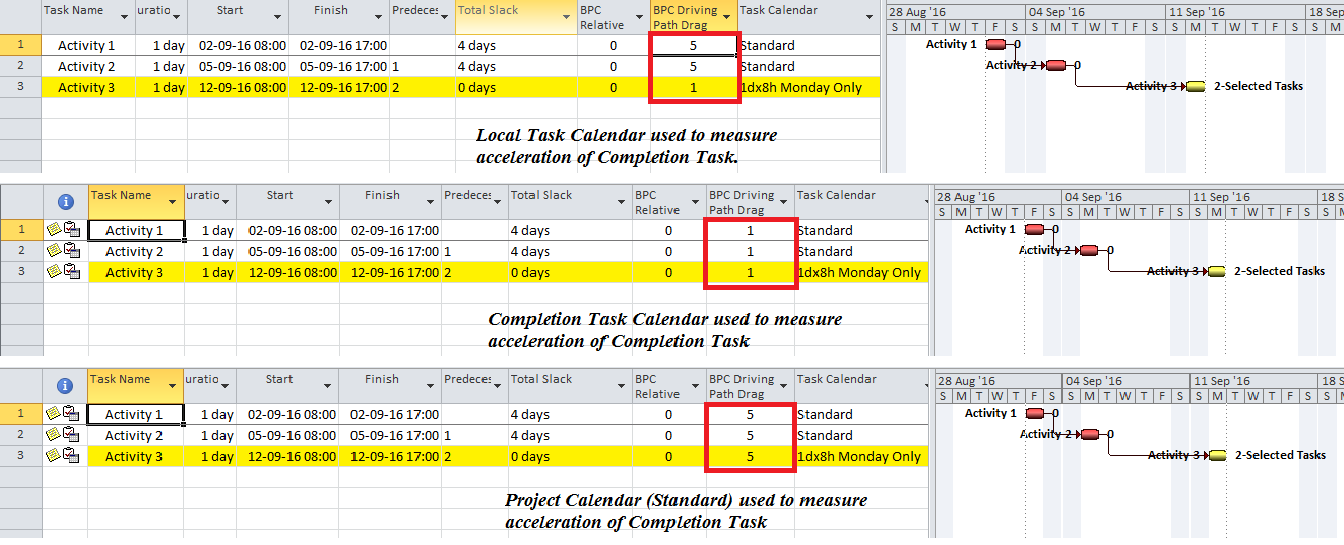
Which is the correct calendar to use? My own preference is to use the calendar of the Completion Task to quantify potential acceleration of the Completion Task (i.e. the middle option above), and this is the default selection in BPC Logic Filter. A detailed logical analysis would assign 1 day of Duration Drag to each of the tasks in the example and a further 4 days of Calendar Drag to Activity 3. There is no logical basis for adding these 4 days of Calendar Drag to any other task, but using a mismatched calendar in a brute-force Drag analysis does exactly that, as shown in the top and bottom options above. Those options remain in BPC Logic Filter to allow consistent comparisons with Drag calculations from other tools.
*In the absence of constraints, variable calendars, and certain relationship lags; the compression of a particular Critical Path task can lead directly to compression of the project. Then the idea that Drag represents the potential productive compression of the task itself (i.e. the mirror image of Total Float/Slack) can appear true. Such a simplified view should not be generalized for complex projects, however.
**Credit and thanks for this example go to Vladimir Liberzon of Spider Project. Spider is one of the few scheduling tools to compute Drag.
***Project correctly computes Total Slack of 4 days for the first two tasks, meaning they could each slip 4 days – according to their own calendars – without delaying the project. MSP marks them non-Critical. They are nonetheless on the driving path to project completion, as shown by BPC Logic Filter, and they possess Drag.