[Article 1 of 2.] This is a summary of the standard definitions and uses of driving logic relationships between activities in project schedules, as applied in Primavera P6 and Microsoft Project software. Driving relationships are often considered fundamental elements of the project critical path.
This winter I worked with a colleague to prepare a paper – Interpreting Logic Paths in Multi-Calendar Project Schedules – for presentation at this year’s AACE International Conference and Expo in Chicago (Covid-19) virtual world. The paper reflects a deep dive into the Multiple Float Path calculation options in Primavera P6 scheduling software. During the technical study, I had a lot of opportunities to think about driving logic relationships. This entry summarizes the standard definitions and uses. I’ve summarized a couple alternate definitions and uses in another article.
The Importance of Driving Logic
The planning and execution of complex projects requires the project team to understand, implement, and communicate the consequences of schedule logic flow to the other stakeholders. Through schedule logic, each activity in the project has the potential to constrain or disrupt numerous other activities – and to be constrained or disrupted by them. The most obvious artifacts of logic flow are the important logic paths, like the critical path, the Longest Path (in Primavera P6), or the driving path to a key delivery milestone. Regardless of the detailed definition, each of these important paths is governed by driving logic relationships from the first activity to the last activity in the path.
Standard Definition and Uses of Driving Logic Relationships
A driving relationship is “A relationship between two activities in which the start or completion of the predecessor activity determines the early dates for the successor activity with multiple predecessors. See also: Free Float.” [That’s the standard definition from AACE International.] Alternately, “A driving relationship is one that controls the start or finish of a successor activity.” [That’s from the PMI publication on CPM Scheduling for Construction.]
For practical purposes, a driving relationship is a predecessor relationship that prevents a successor activity’s early start or early finish from being scheduled any earlier than it is. When an otherwise unconstrained activity has only one predecessor, then it is normally, and obviously, a driving predecessor. When an activity has multiple predecessors, then one or more of them may be driving while the others are non-driving. These distinctions answer the key questions, “Why is this activity scheduled when it is? Why can’t we do it sooner?”
Driving Logic in Primavera P6
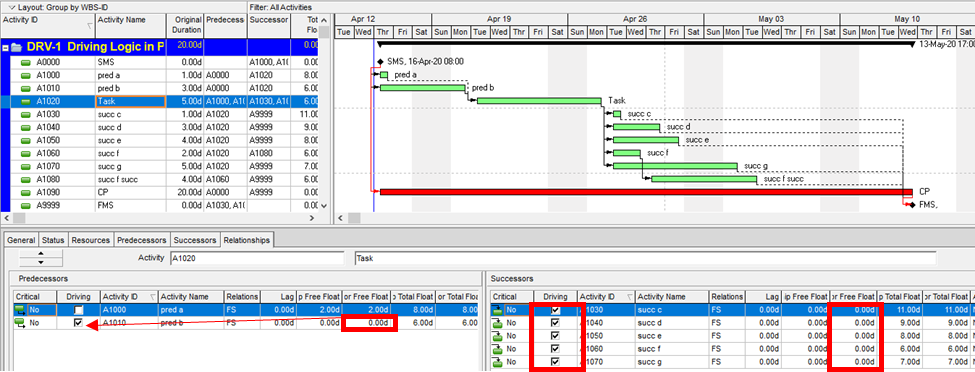
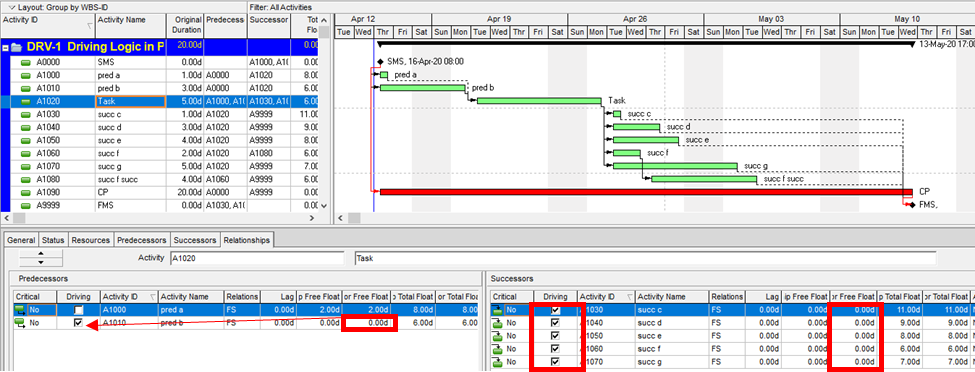
Like its predecessors, P6 routinely illustrates driving logic relationships using solid lines on bar charts – either red or black depending on the “Critical” status of the connected activities. Non-driving relationships are depicted with the same colors, and those that are also non-critical use dotted lines. This is demonstrated in the figure below, where the non-critical activity “Task” (A1020) has two predecessors and five successors. One of the predecessor relationships and all five of the successor relationships are depicted with solid black lines and marked as driving (but not critical) in the relationship tables. The non-driving relationships – one from “pred a” to “Task” and five more from Task’s successors to the project’s finish milestone – are depicted with dotted lines. The two critical, driving relationships that connect the “CP” activity to the project’s start and finish milestones are depicted with solid red lines.
In small projects it is often easy to identify driving logic flow in printed P6 bar charts by visually tracing the solid relationship lines between activities. As project schedules become larger and more complex, however, the number of relationship lines increases to the point that visual tracing becomes impractical. Then driving relationships are primarily identified using the relevant columns of the associated relationship tables. Experienced P6 users often use the “GoTo” buttons in the relationship tables to click-trace along driving logic paths – backward and forward through complex project schedules – to review and confirm important chains of sequential logic (i.e. driving logic paths).
In general, Primavera P6 identifies driving relationships by analyzing the intervals between early dates of the linked activities, after completion of the core scheduling calculations. With a few minor exceptions, a driving relationship is identified when the Relationship Successor Free Float (RSFF) equals zero. In addition to providing a basis for the graphical and tabular depictions of driving logic flow, P6 uses these driving attributes to automatically identify the Longest Path, or the driving path to project completion.
Driving Logic in Microsoft Project
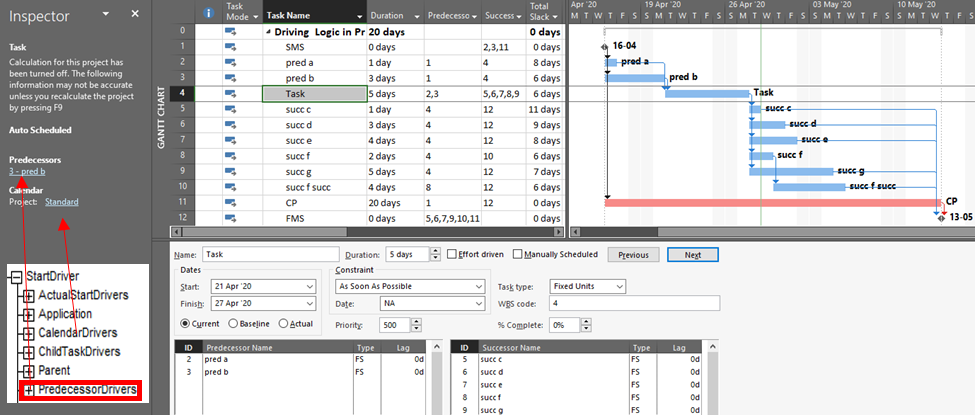
Unlike P6, Microsoft Project (MSP) does not graphically differentiate driving and non-driving relationship lines in Gantt-chart views, and the standard relationship (i.e. dependency) tables provide no driving-logic indicators. The Task Inspector pane provides the primary method for identifying driving predecessors of the currently-selected task; there is no corresponding method for identifying driven successors. The figure below depicts the same schedule as before, now in MSP format, with the Inspector pane identifying a single (driving) predecessor task, “pred b”, for the currently-selected task (“Task.”) As far as it goes, this agrees with P6.
Although not presented to users, driving relationship indicators are developed by MSP (at least since MSP 2007), with the results being stored in the PredecessorDrivers collection for each task. This collection forms the basis of the Predecessors list of the Inspector pane.
It’s also apparent that the PredecessorDrivers data are used to define the Driving Predecessors and Driven Successors bar styles that were introduced as part of the Task Path functionality in MSP 2013. This functionality is illustrated below, where the driving and non-driving predecessors of “Task” – and its driven successors – are all differentiated by bar color. Although there are clear limitations to this graphical approach, the ability to show driving and driven logic paths (if not individual driving relationships) is a major improvement for MSP users.
Unfortunately, the internal MSP calculation of driving logic attributes – and the explicit paths of driving logic that they purport to illustrate – have proven unreliable for complex schedules with other than finish-to-start relationships, out-of-sequence progress, or external links.
Standard Driving Logic in BPC Logic Filter for Microsoft Project
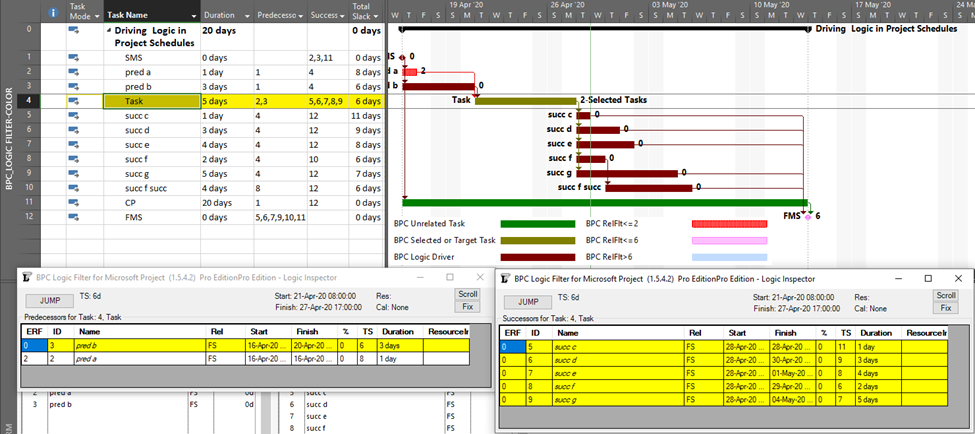
BPC Logic Filter (my company’s add-in for MSP) identifies driving logic by independently analyzing relationship relative floats after completion of the schedule calculations. This is a bit like the P6 approach and has proven, at least for me, more reliable than the internal MSP data when things get complicated. This figure shows the combination of a logic tracer view (with special bar styles depicting driving and near-driving logic paths) together with the task logic inspector tables. Driving relationships are highlighted yellow in the tables. Overall, this seems to combine the best parts of the corresponding P6 and MSP layouts, and the Jump buttons allow for logic-based navigation forward or backward through the schedule network.
Continue to related article…
Alternate Definitions of Driving Logic Relationships in Project Schedules


Thanks for your detailed insights Tom, I was unaware of the predecessor drivers field in Microsoft Project but had used the task inspector and also the task path features. I sometimes use grouping in Microsoft Project to segregate critical and non critical activities. I guess though more than anything else the challenge is in communicating this information to audiences who are not familiar with the principles of CPA.
Hi Dom, I appreciate the comment. I agree that effective communication of our plan – including the schedule sequences – is a substantial part of the battle.