In a departure from an earlier study, the resource-leveled schedule generated using Microsoft Project (MSP) 2016 may sometimes be substantially shorter than the comparable schedule from MSP 2010. The result suggests a more sophisticated leveling algorithm that, while sometimes generating shorter schedules, may increase the associated resource-related risks.
Several years ago I wrote an article examining some reported differences in resource leveling behavior between Microsoft Project (MSP) 2010 and 2013 versions. In general, those observations implied that the newer software was generating longer schedules under default conditions. (The observations were by others, since at the time I was only using MSP 2010.) I concluded the article with a speculation that the leveling algorithm may have been adjusted to preserve the appearance of the pre-leveling “Critical Path,” but at the expense of a longer schedule.
A recent test case using MSP 2016 does nothing to confirm that speculation, and an opposite conclusion is implied.
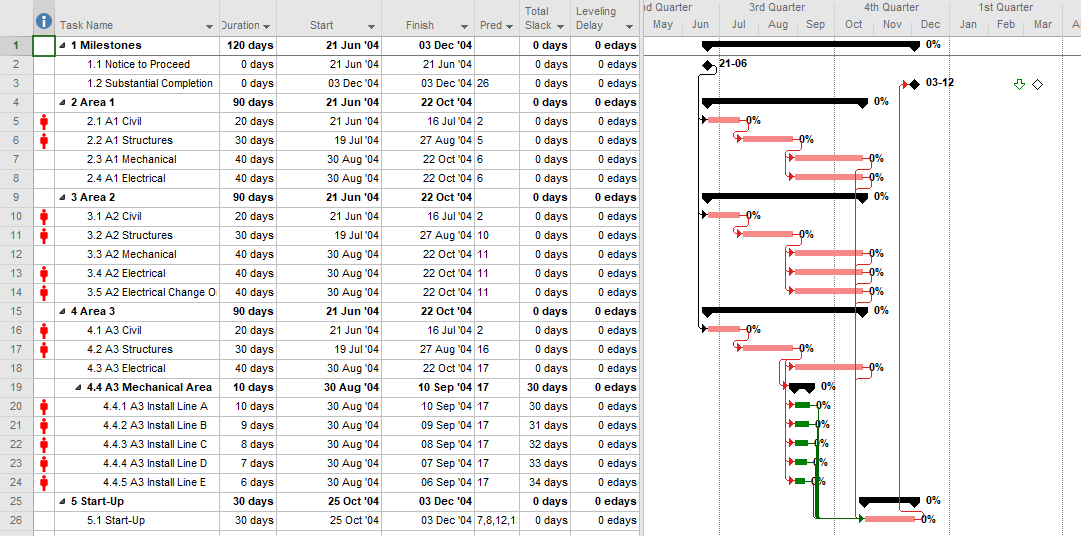
Below is an idealized schedule for construction and commissioning of a small processing plant, including resource loading. Only technologically-required logic is included, so that a) the resources are all severely overallocated, and b) the schedule is unrealistic. The same schedule is shown in both MSP 2010 and MSP 2016 forms, with only cosmetic differences. There is a Deadline of 25Feb’05 on the Substantial Completion task, and no explicit risk buffers are present. [The MSP 2010 form was used to illustrate the resource-leveled critical path in a technical paper I presented at AACE International in 2017.] 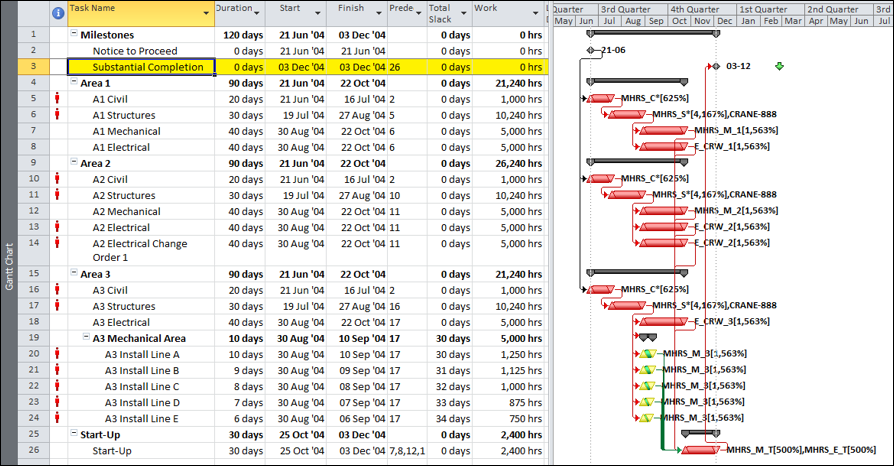
To resolve the resource over-allocations and generate a more realistic schedule, the resource leveler is applied in both MSP 2010 and MSP 2016 using simple leveling options with no task priorities defined.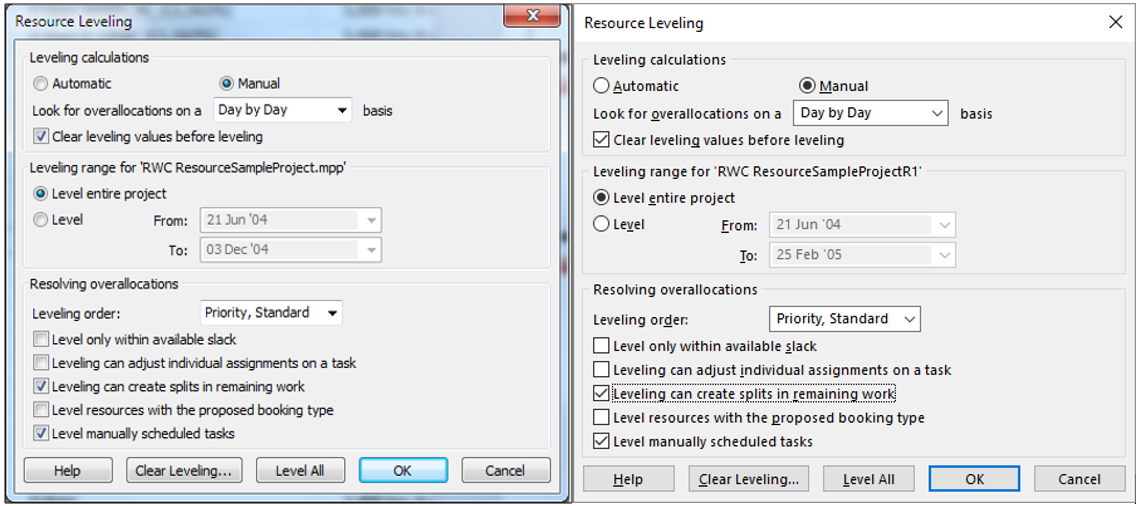
As shown below, these options lead to completely different schedules in the two tools, with MSP 2016 generating a leveled schedule that is 10-days shorter than the MSP 2010 version.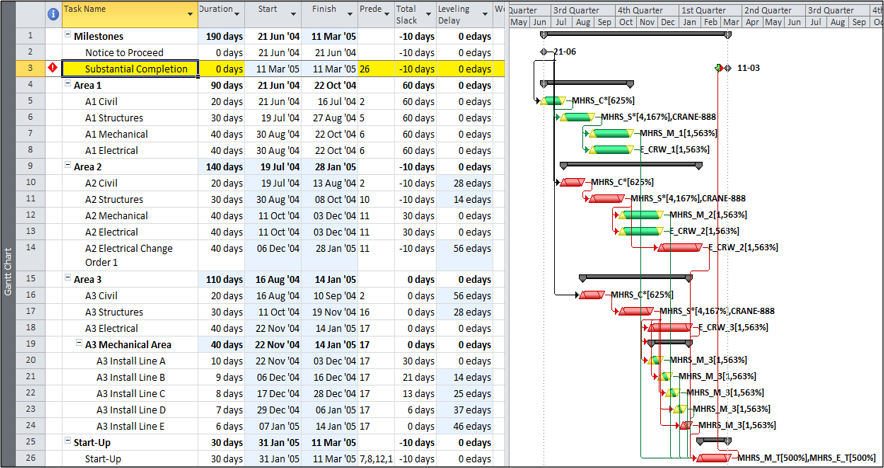
Key observations:
- The MSP 2010 schedule failed to meet the Deadline, so more tasks are marked Critical due to zero-or-negative Total Slack. Six tasks including the two milestones have TS=-10d (i.e. the “most critical” as defined by Total Slack.)
- The MSP 2010 leveler did not impose any task splits, even though they were allowed.
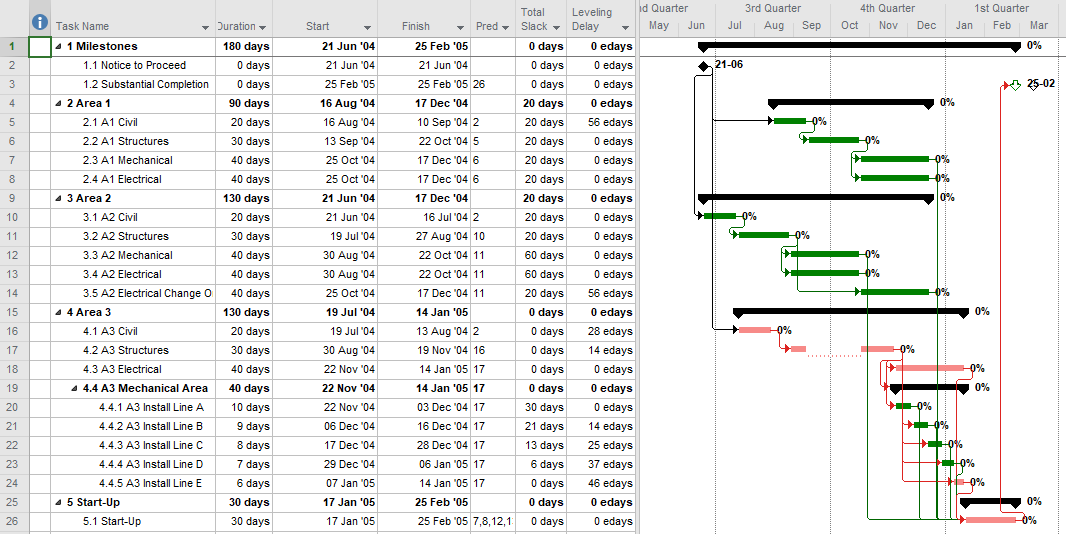
- The MSP 2016 schedule meets the Deadline, so no negative slack is imposed. Seven tasks including the two milestones have TS=0 (the “most critical.”)
- The MSP 2016 leveler imposed a task split on one task (A3 Structures).
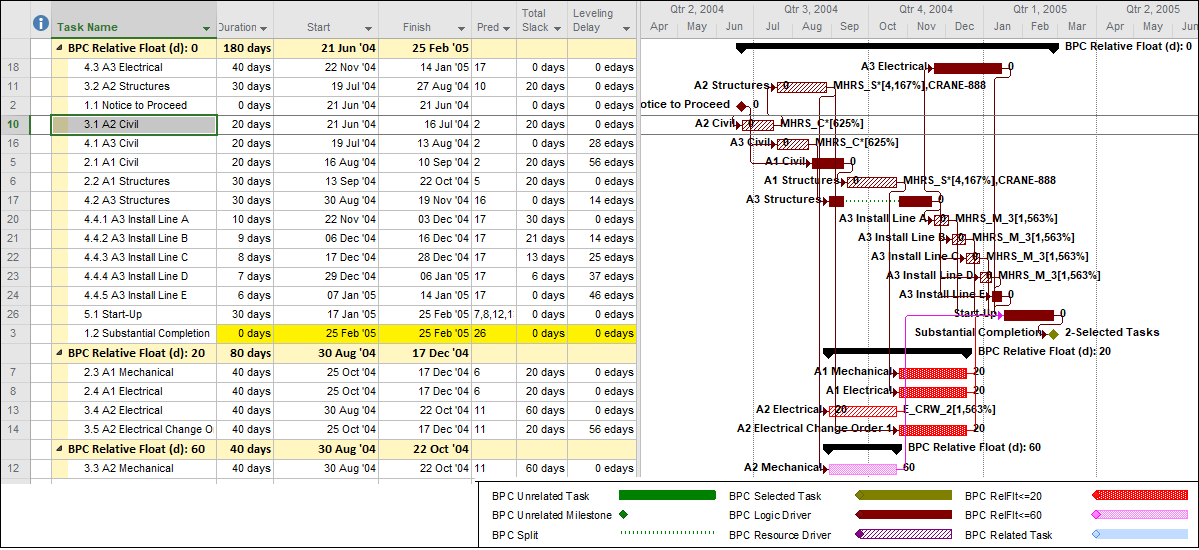
A close look at the Resource-leveled Critical and Near Critical paths – Using the Near Longest Path Filter in our BPC Logic Filter add-in – demonstrates that MSP 2016’s leveler creates a more condensed schedule. Specifically:
- MSP 2010 generates a single continuous Resource-leveled Longest Path (BPC Relative Float = 0) comprised of eight tasks in sequence. The other 12 tasks possess 10 to 70 days of relative float.

- MSP 2016 generates a continuous Resource-leveled Longest Path of 13 tasks in sequence, with 2 additional tasks (and a split part of one of the original 13) in parallel branches. The other 5 tasks possess from 20 to 60 days of relative float. As a result, more of the work is both concurrent AND Critical.
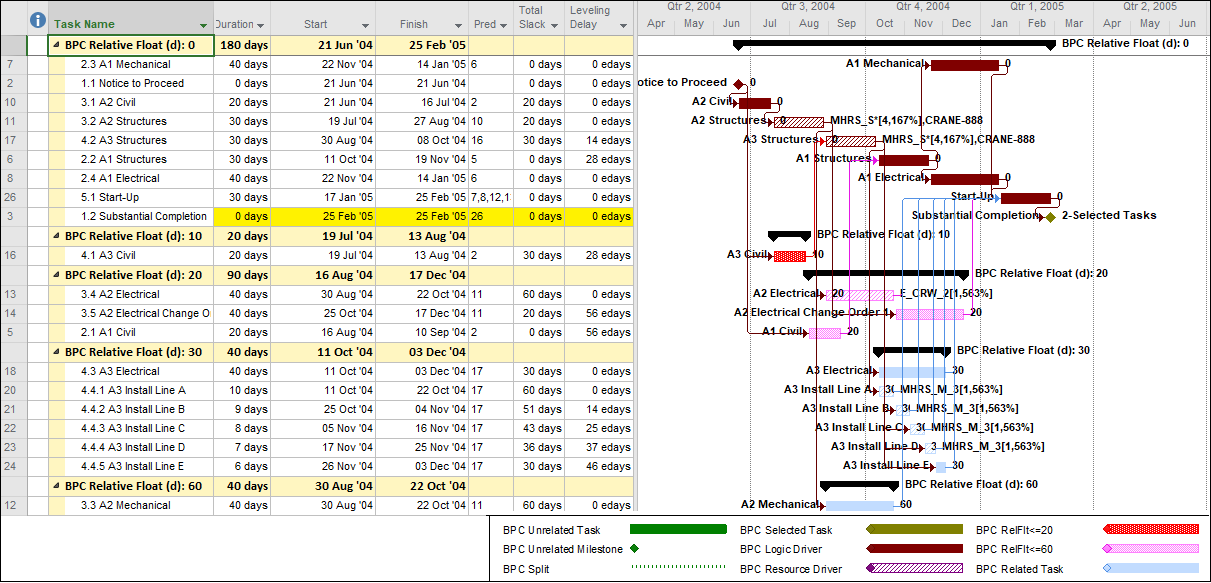
 It turns out that the splitting of the A3 Structures task is not the key to the more condensed schedule in MSP 2016. In fact, re-running the leveler while disallowing splits leads to a schedule that – with no splits and with a completely different sequential arrangement – finishes at the same time.
 The corresponding Resource-leveled Longest Path is comprised of only 8 tasks in sequence, with 1 additional, parallel/concurrent task. This leveled schedule has fewer resource mobilizations and disruptions along the longest path while still finishing at the earliest leveled time; it appears to be lowest risk.
This example suggests that MSP 2016’s default resource leveling algorithm may be substantially more sophisticated than MSP 2010’s, and it promises – under the right circumstances – to offer shorter leveled schedules in the absence of explicit user-defined priorities. The shorter schedules may also be accompanied by technical and resource risks associated with multiple, concurrent branches of the resource-critical-path. Project managers using resource leveling are advised to consider and buffer these risks appropriately.
In contrast with this finding and in keeping with the prior version of this article, others have continued to observe consistently longer schedules being generated by MSP 2016 (compared to MSP 2010 and earlier), on some standardized schedule models. These observations are noted in the comments.

Tom, you know about tests made by Evgeny Zorin and discussed on planningplanet,com.
They showed that though in some projects MSP 2016 produced better results in more projects it produced worse resource leveled schedules than MSP 2010 and MSP 2007.
One project does not prove that some algorithm is better than another.
Hi Vladimir,
Thanks for having a look. My recollection – possibly incorrect – was that Zorin’s tests did not include MSP 2016 (only 2007, 2010, and maybe 2013). I’ll review those PP studies again and make necessary revisions to this article. I’d agree that “one project does not prove that some algorithm is better than another.” Repeatable qualitative observations of a small number of samples (four in this case) are, nevertheless, not necessarily invalid.
Zorin’s report was presented at Construction CPM Conference 2017. Look at http://www.spiderproject.com/images/img/pdf/Construction%20CPM%20Conference%202017/Resource%20Constrained%20Scheduling%20Capabilities%20Zorin%20Liberzon.pdf slide 37.
Of course 25 projects from PSLIB also are not sufficient for firm statements but the study was objective and Zorin himself was MS Project user.
Just to confirm, the tests reported by Evgeny Zorin in two discussion threads of Planning Planet (which I linked in the earlier version of this article) were limited to MSP 2007 and MSP 2010. I had also recalled another (unlinked) post on PP where Vladimir implied even longer schedules from MSP 2013/2016, though that was without specific data.
Tom, tests were done by Zorin. You can ask him about detailed results at planningplanet.com. Let me know about the results of your investigation. I remember that Zorin published the table with the test results but am not sure that he included there different versions of MSP. But projects that were selected from PSLIB are known.
Unfortunately the slide at the presentation that was suggested in the previous comment is damaged. So look at another presentation where I put the same results at slide 48: http://www.spiderproject.com/images/img/pdf/Construction%20CPM%20Conference%202019/Beyond%20CPM.pdf
Vladimir,
Thanks for sharing these two slideshows; I believe I attended your presentation of the most recent one earlier this year. I have no reason to doubt the veracity of the claims made regarding MSP 2013 and MSP 2016 leveling performance, though it would be good to see the detailed test results presented in a table like Zorrin’s post on Planning Planet.
According to the summaries you’ve shared, MSP 2013/2016 generated the shortest leveled schedules (compared to 2007 and 2010) in only 16% of the “most interesting” scenarios from the PSP library. It was surprising, therefore, to find one of our standard projects for illustrating resource leveling in construction projects (first introduced by Ron Winter about 15 years ago) among the outliers. Exactly how it compares to the “most interesting” PSPLIB scenarios – and how closely those PSPLIB networks represent real-world projects – would require further study.