While writing an article on Multiple Critical Paths a few years ago, I knew that BPC Logic Filter (our add-in for Microsoft Project) could easily identify multiple critical paths (and near-critical paths) in any project schedule, but we needed to analyze key milestones one at a time. In most cases I think that’s still the best approach to understanding the factors that drive (and may delay) key project deliverables. Nevertheless, the latest build of the software (1.5.5.13) includes a new setting that facilitates simultaneous analysis and display of the critical paths to multiple milestones in a project or program schedule.
The setting – Group Results by Selected Task – is found on the Tracing Preferences tab of the software settings, and we enabled it as part of the initial distribution of the build. We hope that at least a couple users have been pleasantly surprised.
This short article provides a couple illustrations of the feature in action.
First, here is the simple example project from the previous article. The project comprises six “phases” of inter-related tasks in a Microsoft Project schedule, now displayed using MSP 2016 rather than MSP 2010 as before. The project has no deadlines or constraints, and MSP designates critical tasks (red bars in the chart) based on total slack (TS<=0).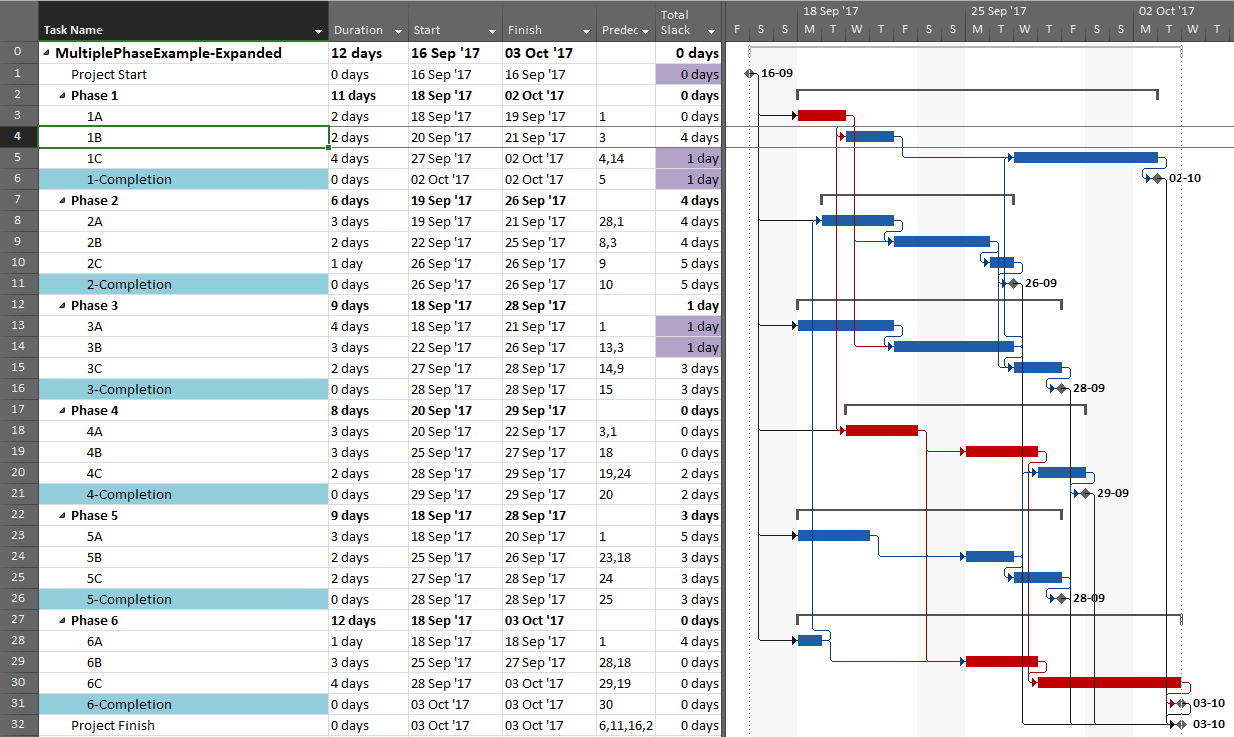
In the previous article, I illustrated – using MSP and Oracle P6 – several generic techniques to identify the unique critical path for each of the six phase completion milestone in the project. I also used BPC Logic Filter to graphically illustrate the critical- and near-critical paths for the Phase 1 completion milestone, displayed within the context of the overall project (and repeated here in MSP 2016).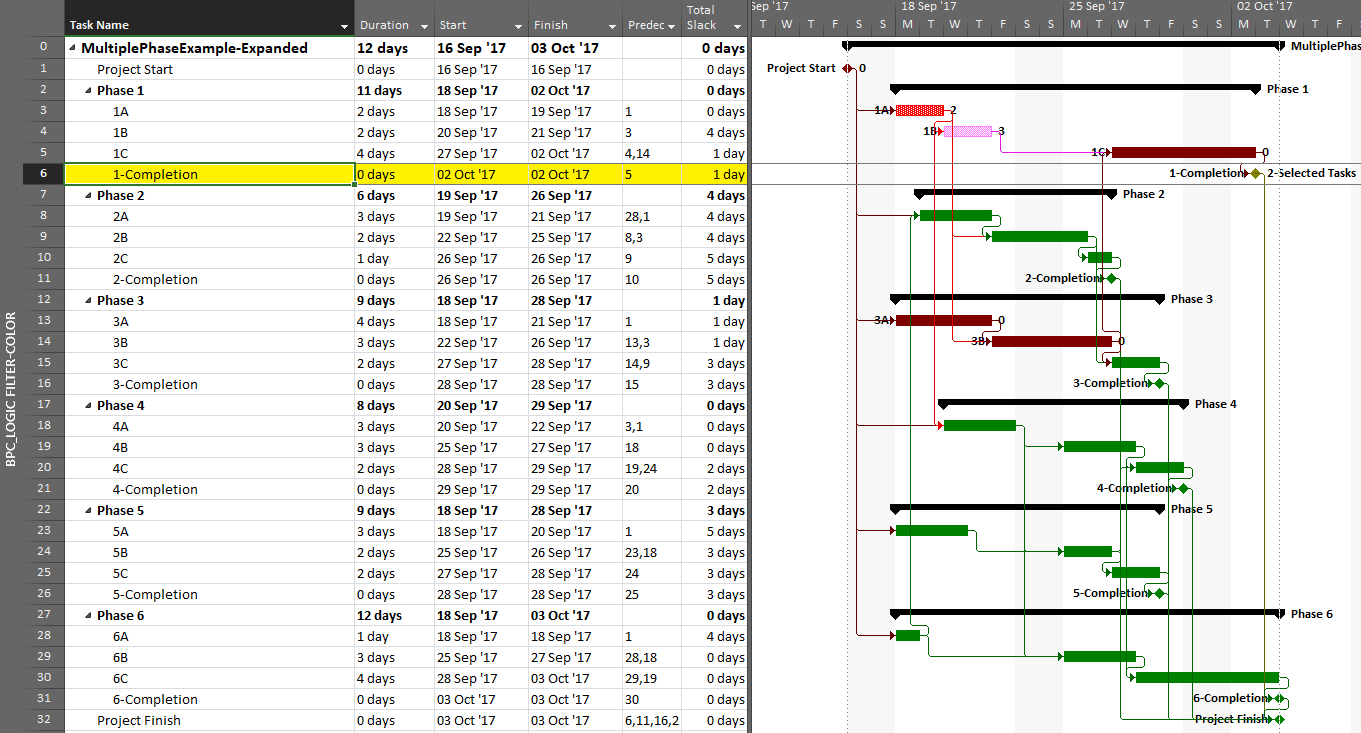
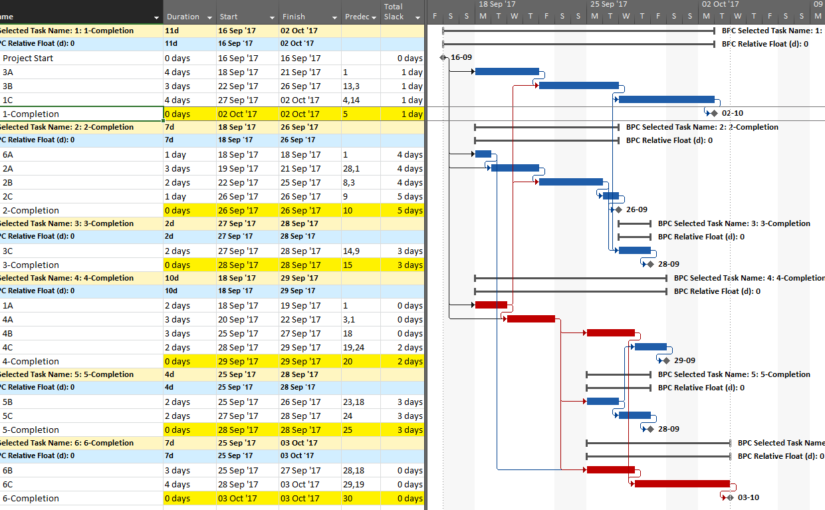
Going back to the original project, we can now run the task logic tracer with all six phase-completion milestones selected. The Standard Edition of BPC Logic Filter then allows us to select driving-path predecessors and to re-sort the results to show logical branches (i.e. paths).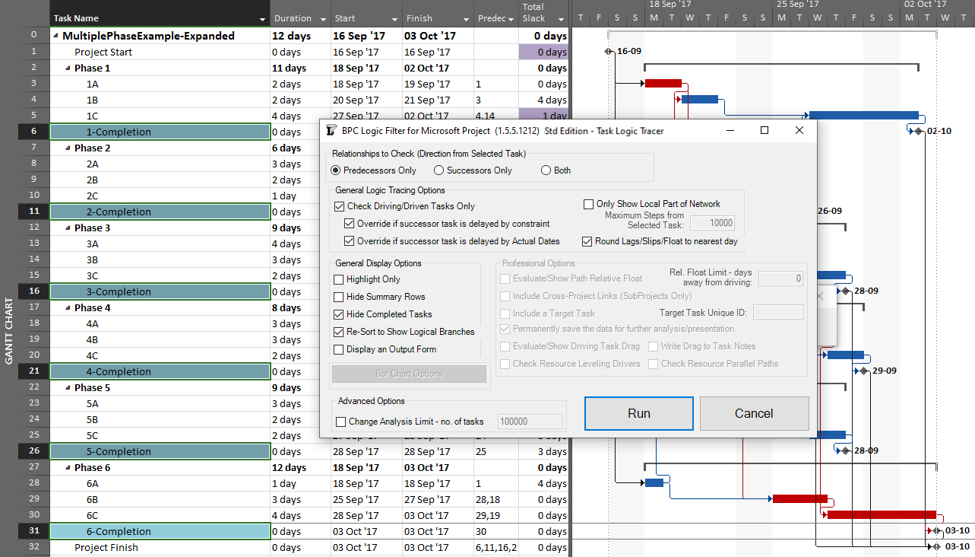
The result is a grouped view displaying the driving predecessor path to each of the six phase-completion milestones.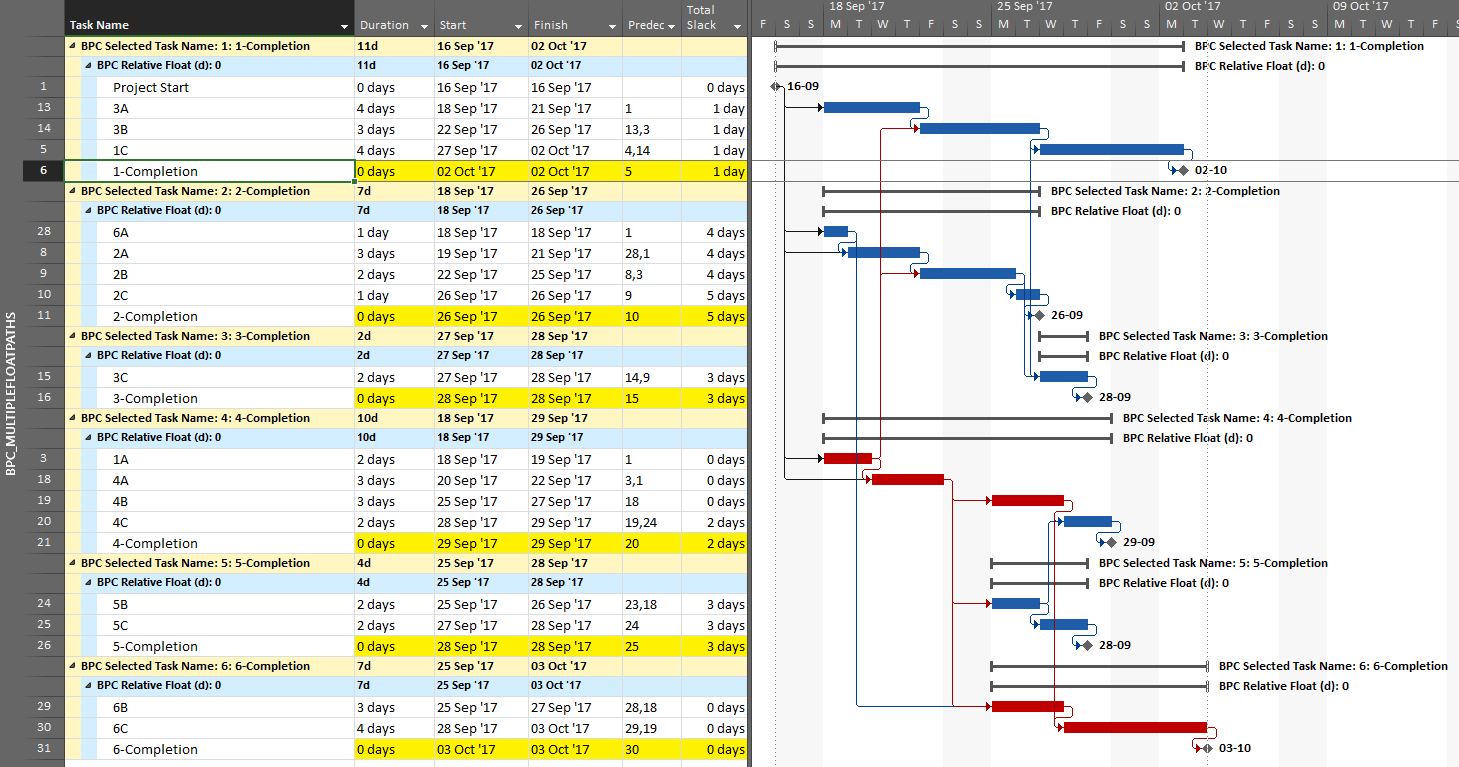
Due to intersecting logic, some tasks are on the driving/critical path for more than one completion milestone, but the Gantt chart only allows them to be displayed once. The task logic tracer displays such tasks together with the driven milestone that is encountered first in the original task selection. Thus, while tasks 1A, 4A, and 4B are critical for the overall project and for the phase-6 completion, they are displayed with the phase 4 completion milestone – for which they are also driving/critical – because that milestone was encountered first in the user’s selection. As a consequence, re-sorting the tasks in the overall project can alter the apparent driving paths for key delivery milestones when intersecting logic is present.
The same caveat applies when considering near-driving/critical paths for multiple key milestones in the same project, along with an added condition that a non-driving task will be included with whichever key milestone it is nearest to driving. To illustrate, we have re-run the previous analysis while considering path relative float, and we’ve decided to re-color bars to clarify results.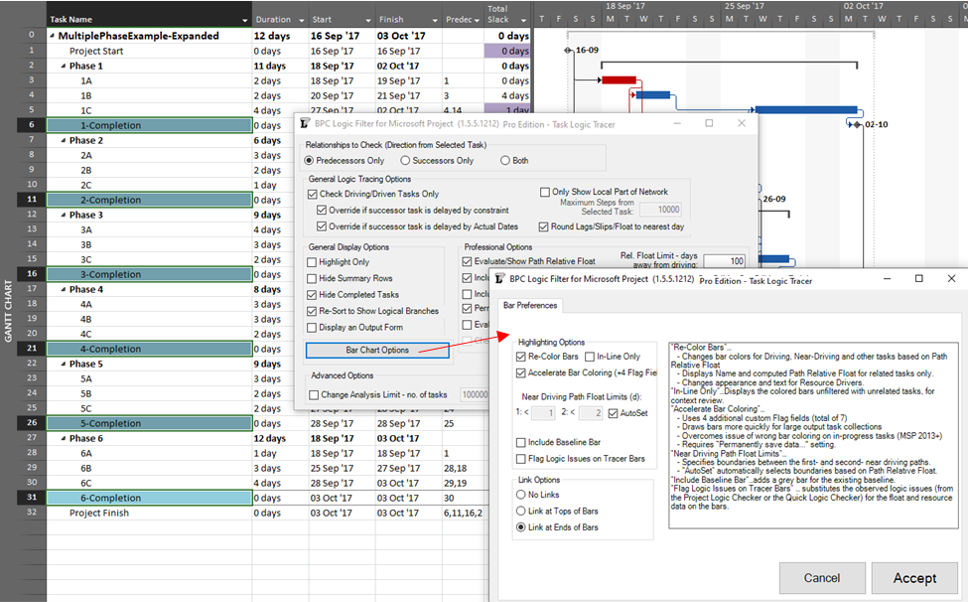
The resulting output is like the earlier one, but now including annotated bars and tasks whose path relative float is above zero (i.e. non-driving).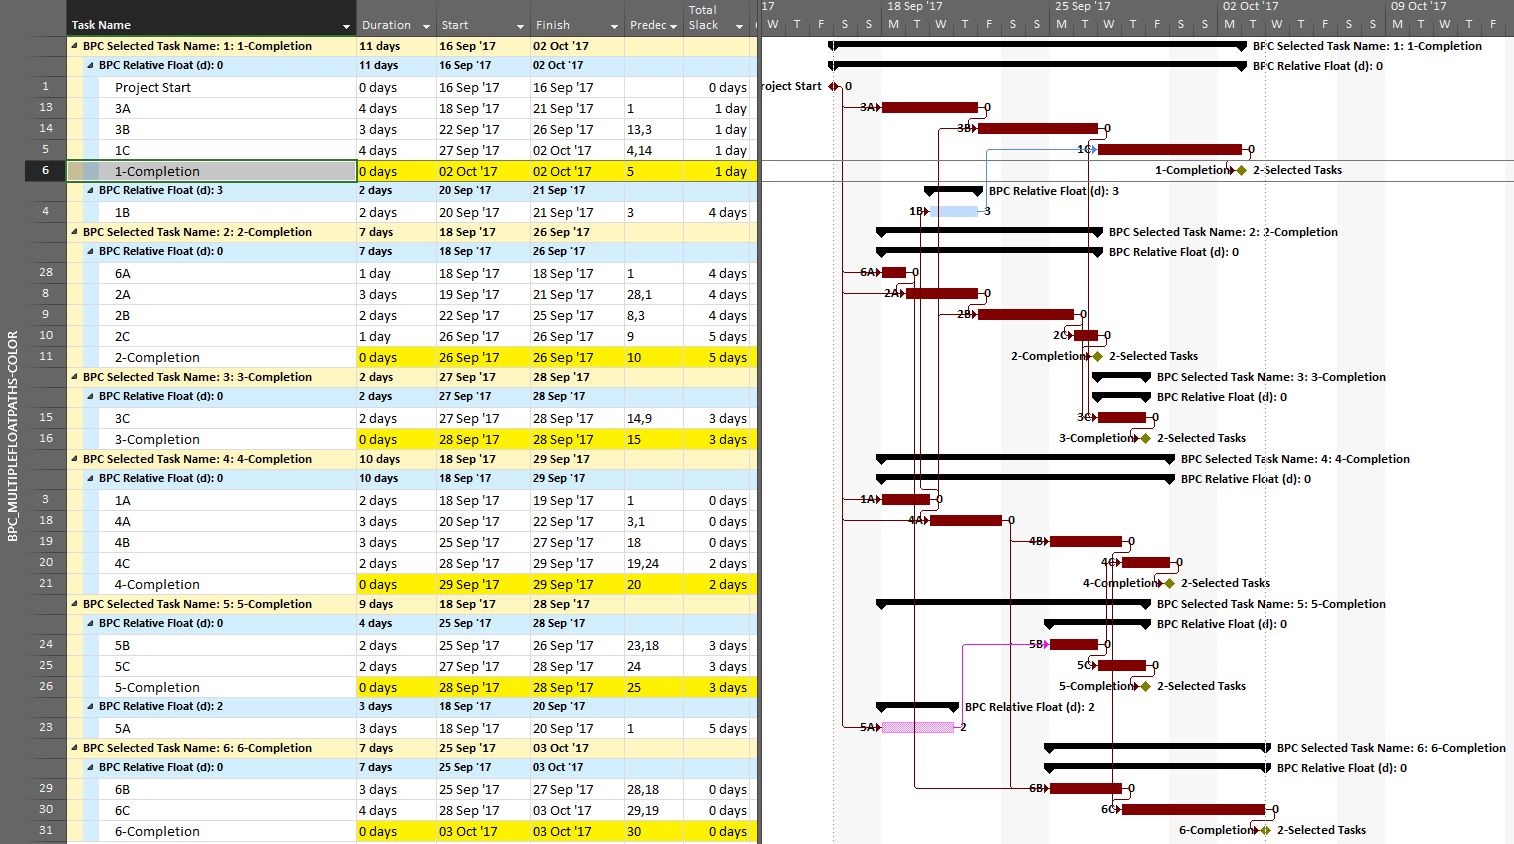
From the earlier article, we already know that task 1A is a non-driving path predecessor of the phase-1 completion milestone, 2 days from driving that milestone. It is nearer to driving (and is in fact driving) the phase-4 completion, however, so that is where it is shown.
As we’ve seen, it can be difficult to differentiate the critical paths to multiple completion milestones in a complex project with lots of intersecting logic paths. When a project or program includes multiple completion phases that are not closely related, however, the output is straightforward. A good example of this case occurs when multiple unrelated subprojects are combined into a linked master project for reporting purposes. Here I’ve used the New Window dialog to temporarily combine three simple projects into a temporary master. Then I have applied a filter to show only the key completion milestones for the three subprojects. Finally. I’ve run the task logic tracer with all the visible tasks selected. A Pro Edition of the tool is required to analyze linked subprojects, and I’ve limited the relative float analysis to keep the resulting output small.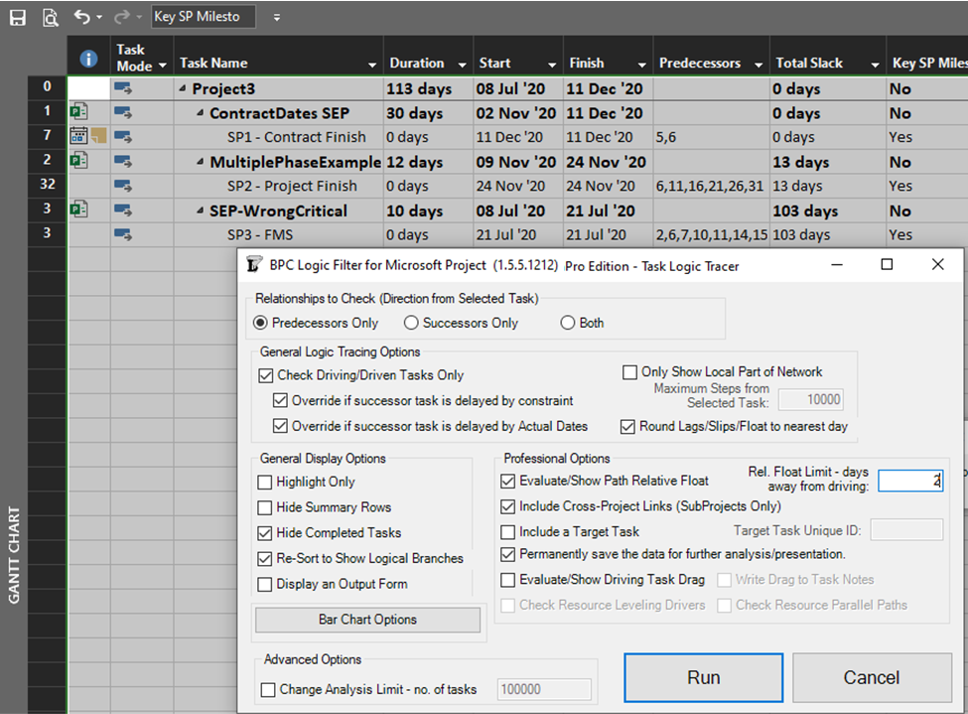
The resulting layout clearly depicts the critical/driving- and near-critical/driving paths for each subproject completion milestone. As usual – for BPC Logic Filter – the definitions of critical/driving logic paths do not rely on the total slack, which is not reliable in many modern project schedules.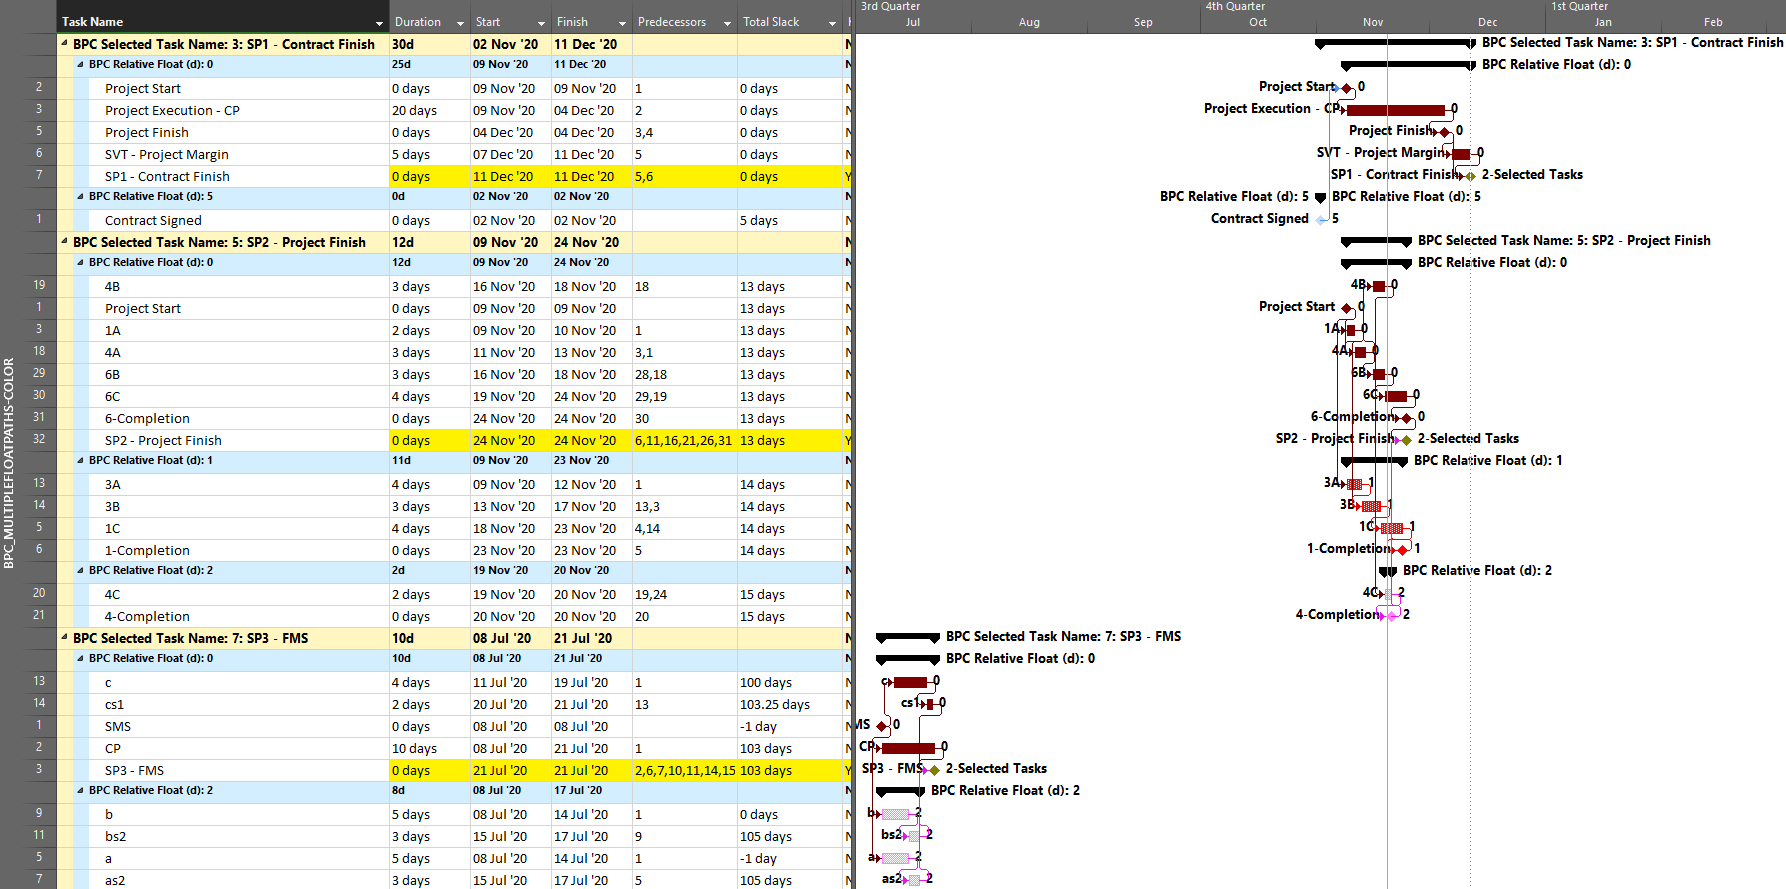
Hello,
please would sincerely appreciate your response – do you know a tool compatible with Primavera P6 where you can create a report showing driving and non-driving predecessors for any activity to the HIGHEST POSSIBLE NUMBER OF PREDECESSOR LEVEL where driving relationships are highlighted and while links to inactive predecessors are also listed?. Much like having the trace logic visual in p6 but listed in a report. or Do you know how I can create this report in P6?. All the reports and tutorials are showing this information to predecessor level 1…
Tola, Thanks for commenting. I don’t have an easy answer to your question. I think you will come closest using Multiple Float Path analysis (with free-float option and blank number of paths), specifying your ending-with activity.
Tola, in what form do you need such report? In Spider Project it is possible to apply filters and to show all predecessors or all successors (or both) to selected activities in the Gantt Chart with driving links thicker than non-driving. Is this close to what you are looking for?